Figures & data
Figure 1 Study flow chart and patient selection procedure.
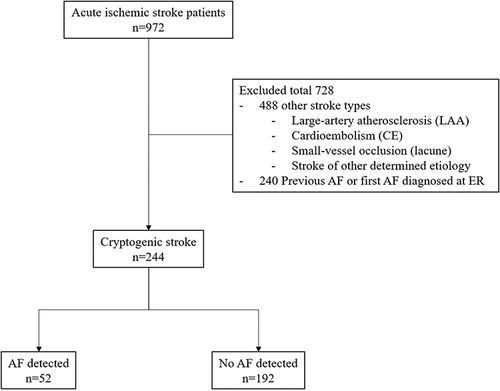
Figure 2 P-wave terminal force in lead V1 (PTFV1) measurement by WebPlotDigitizer (A) 12-lead echocardiography with PTFV1, (B) X and Y axes calibration, and (C) acquired data and PTFV1 calculation. PTFV1 = 5000 µV msec.
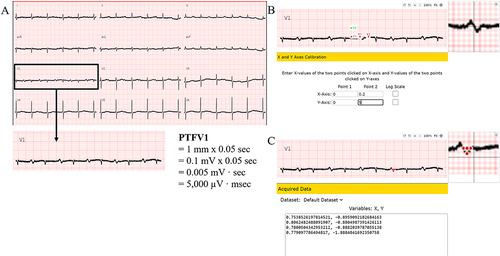
Figure 3 P-wave dispersion (PWD) measurement by WebPlotDigitizer (A) 12-lead electrocardiography with PWD, (B and C) axes calibration and acquired data to measure maximal and minimal P wave duration, respectively. PWD = 115 msec.
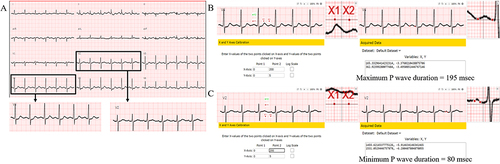
Table 1 Baseline Characteristics of the Patients
Table 2 Cardiac Biomarkers, Electrocardiography, Echocardiography, and Neuroimaging Parameters of the Patients
Table 3 Univariable Analysis
Table 4 Multivariable Analysis
Table 5 Significant Predictors and Assigned Item Scores for In-Hospital Newly Diagnosed Atrial Fibrillation
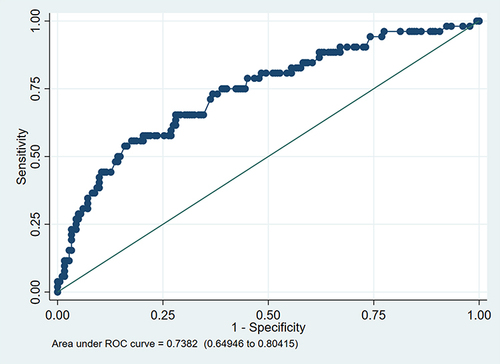
Figure 4 Area under receiver operating characteristics (AuROC) curve.