Figures & data
Table 1 Basic Information of the Data Set in This Study
Figure 1 Hypoxia gene signature in colon cancer. (A) Forest map of 19 hypoxia-associated genes by univariate Cox analysis; (B) Pearson correlation analysis of 19 hypoxia-associated genes; (C) Interaction network of 19 hypoxia-associated genes mapped by Cytoscape. The Orange circle represents that hypoxia-associated genes were the risk factors of OS. The blue circle represents that hypoxia–associated genes were the favorable factors for OS. The blue line represents a negative correlation between two genes, and the depth of the color represents the strength of the correlation. The Orange line represents a positive correlation between two genes, and the depth of the color represents the strength of the correlation. (D) The lasso regression analysis; (E) The partial likelihood deviance for the lasso regression.
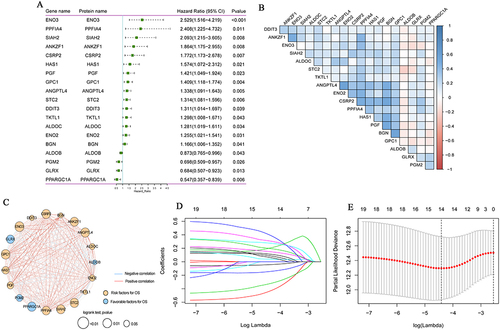
Figure 2 Distributions of risk score (A), OS status (B), heat map of signature genes (C) and survival of patients with high risk score and low risk score (D). The TCGA-colon cancer dataset on the left is training set and the GSE17536 dataset on the right is test set. P < 0.05 was considered statistically significant.
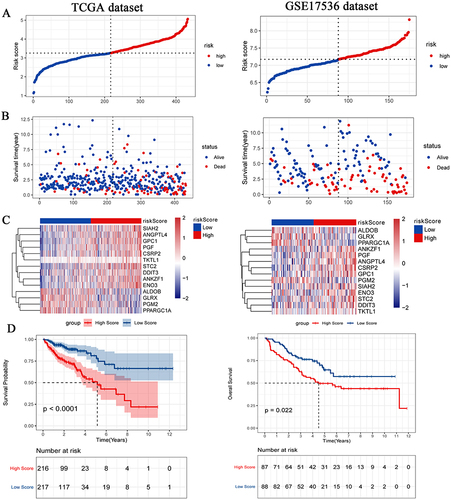
Figure 3 Prognostic value of the hypoxia gene signature in colon cancer. (A) ROC curves showing the predictive efficiency of the hypoxia gene signature on the 1-, 3-, and 5-years survival rate in TCGA-colon cancer dataset; (B) ROC curves showing the predictive efficiency of the hypoxia gene signature on the 1-, 3-, and 5-years survival rate in GSE17536 dataset; (C) Univariate Cox analysis of hypoxia gene signature to evaluate the independent prognostic value of OS in colon cancer patients; (D) Multivariate Cox analysis of hypoxia gene signature to evaluate the independent prognostic value of OS in colon cancer patients. **P <0.01; ***P <0.001.
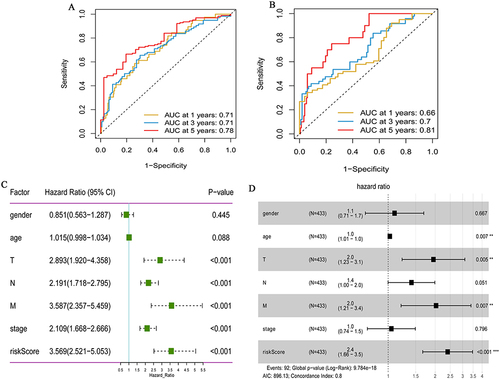
Figure 4 Gene set enrichment analysis (GSEA) results in the high risk score group.
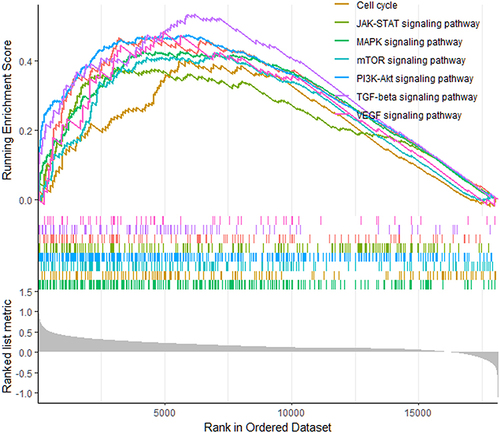
Figure 5 Difference in immune cells (A), immune score (B), stromal score (C), ESTIMATE score (D) and tumor purity (E) between high and low risk score groups. *P <0.05; **P <0.01; ***P <0.001;****P <0.0001. P < 0.05 was considered statistically significant.
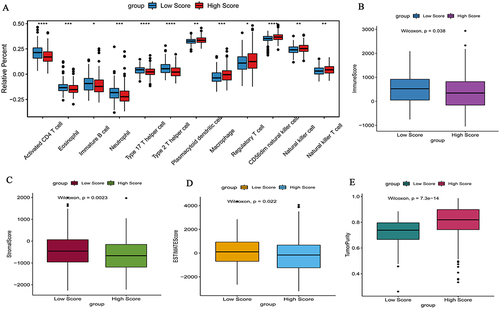
Figure 6 Expression of cancer-immune cycle negative regulatory genes in high and low risk score groups. (A) Heat map of cancer-immune cycle negative regulatory genes in high and low risk score groups in the TCGA-colon cancer dataset. The clustering is constructed using the full chain method together with the Euclidean distance. Each row and column represents a cancer-immune cycle negative regulatory gene and a sample, respectively. Orange indicates above the reference channel (high expression genes). Blue indicates below the reference channel (low expression genes). (B) Heat map of cancer-immune cycle negative regulatory genes in high and low risk score groups in the GSE17536 dataset. The clustering is constructed using the full chain method together with the Euclidean distance. Each row and column represents a cancer-immune cycle negative regulatory gene and a sample, respectively. Orange indicates above the reference channel (high expression genes). Blue indicates below the reference channel (low expression genes). (C) Box plot of cancer-immune cycle negative regulatory genes in the TCGA-colon cancer dataset; (D) Box plot of cancer-immune cycle negative regulatory genes in the GSE17536 dataset. *P <0.05; **P <0.01; ***P <0.001;****P <0.0001.
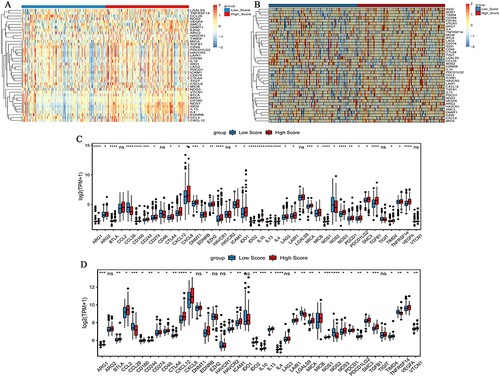
Figure 7 Expression of immune checkpoints and genes mutations between high and low risk score groups. (A) Expression of immune checkpoints in high and low risk score groups in the TCGA-colon cancer dataset; (B) Expression of immune checkpoints in high and low risk score groups in the GSE17536 dataset; (C) Waterfall chart of genes mutations in the low risk score group in the TCGA-colon cancer dataset; (D) Waterfall chart of gene mutations in the high risk score group in the GSE17536 dataset. *P <0.05; **P <0.01.
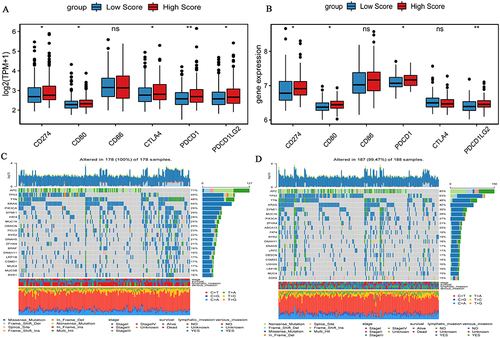
Figure 8 Activity and proliferation of colon cancer cells HCT116 after knockdown ANKZF1. (A) Real time-PCR was used to detect the expression of ANKZF1 to screen out effective interference targets in HCT116; (B) CCK8 was used to detect the activity of cancer cells in NC, Si-ANKZF1, NC+1% O2 and Si-ANKZF1+1% O2 groups; (C) Flat panel clone experiment was used to detect the proliferation of cancer cells in NC, Si-ANKZF1, NC+1% O2 and Si-ANKZF1+1% O2 groups; (D) Histogram of cell proliferation detected by flat panel clone experiment. *P <0.05; **P <0.01; ***P <0.001; ###P <0.001; ****P <0.0001.
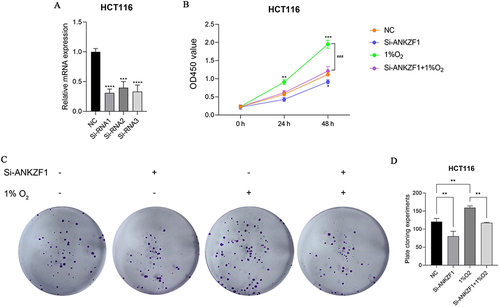
Figure 9 Migration and invasion of colon cancer cells HCT116 after knockdown ANKZF1. (A) Cell wound scratch experiment was used to detect the migration of cancer cells in NC, Si-ANKZF1, NC+1% O2 and Si-ANKZF1+1% O2 groups. Observation under 40x microscope. (B) Histogram of cell migration detected by cell wound scratch experiment; (C) Transwell was used to detect the invasion of cancer cells in NC, Si-ANKZF1, NC+1% O2 and Si-ANKZF1+1% O2 groups. Observation under 200x microscope. (D) Histogram of cell migration detected by transwell. *P <0.05; ***P <0.001; ****P <0.0001.
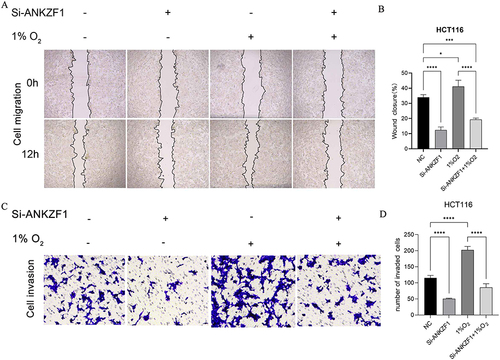
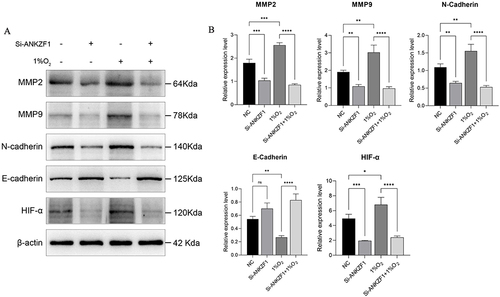
Figure 10 Western blot was used to detect the protein expression levels of MMP2, MMP9, N-Cadherin, E-Cadherin and HIF-α in NC, Si-ANKZF1, NC+1% O2 and Si-ANKZF1+1% O2 groups. (A) The expression bands of MMP2, MMP9, N-Cadherin, E-Cadherin and HIF-α in NC, Si-ANKZF1, NC+1% O2 and Si-ANKZF1+1% O2 groups were detected by Western blotting; (B) The relative expression levels of MMP2, MMP9, N-Cadherin, E-Cadherin and HIF-α proteins in NC, Si-ANKZF1, NC+1% O2 and Si-ANKZF1+1% O2 groups. *P <0.05; **P <0.01; ***P <0.001; ****P <0.0001.