Figures & data
Table 1 Clinical Features of 24 Patients with Colon Adenocarcinoma for Quantitative Real-Time Polymerase Chain Reaction (PCR)
Figure 1 Expression of P4HA3 in colon adenocarcinoma (COAD). (A) Expression status of P4HA3 in 33 tumor types versus normal colon tissues of healthy individuals obtained from TCGA pan-cancer data. (B) P4HA3 expression status in normal colon tissues of healthy individuals and COAD tumor tissues from TCGA. (C) Comparison of expression of P4HA3 between COAD tumor tissues and paired cancer-adjacent tissues. (D) Relative P4HA3 mRNA levels in COAD tumor tissues and paired cancer-adjacent tissues as determined by polymerase chain reaction (PCR). ***P<0.001; **P<0.01; *P<0.05.
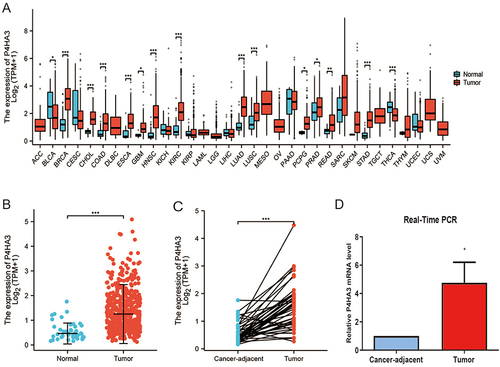
Table 2 Correlation Analyzed Between P4HA3 Expression and Clinical Features in Colon Adenocarcinoma Based on TCGA
Figure 2 P4HA3 expression is associated with clinicopathological characteristics in colon adenocarcinoma (COAD) patients. Wilcoxon rank sum test was applied to analyze the association of P4HA3 expression with age (A), pathological stage (B), T stage (C), N stage (D), perineural infiltration (E), lymphatic infiltration (F), M stage (G), gender (H), and body mass index (BMI) (I). TPM, transcripts per million. ***P<0.001; **P<0.01; *P<0.05.
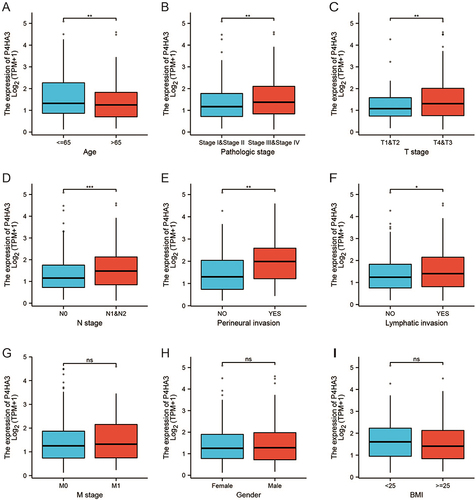
Figure 3 Assessment of the diagnostic performance of P4HA3 by receiver operating characteristic (ROC) curve analysis in colon adenocarcinoma (COAD) patients. ROC curve analysis was used to determine the ability of P4HA3 as a classifier to distinguish normal subjects from COAD patients (A) and COAD patients with different TNM stages (B–J) and pathological stages (K–N).
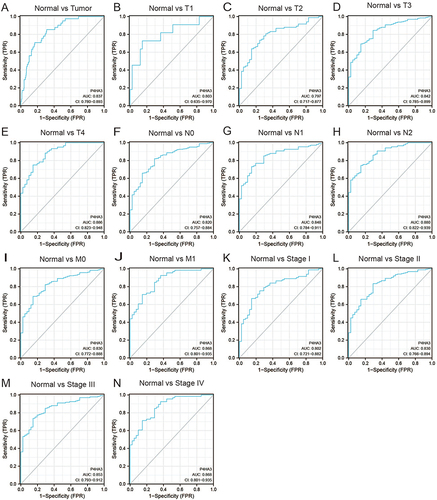
Figure 4 The prognostic value of P4HA3 in patients with colon adenocarcinoma (COAD). (A) Overall survival (OS) and (B) progression-free interval (PFI) of COAD patients based on P4HA3 expression data from TCGA. (C) OS and (D) disease-free survival (DFS) of COAD patients based on P4HA3 expression from GEPIA database.
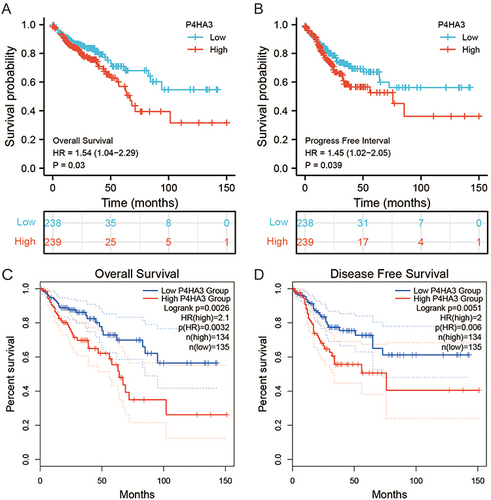
Figure 5 Function enrichment analysis of P4HA3 Correlated Genes.
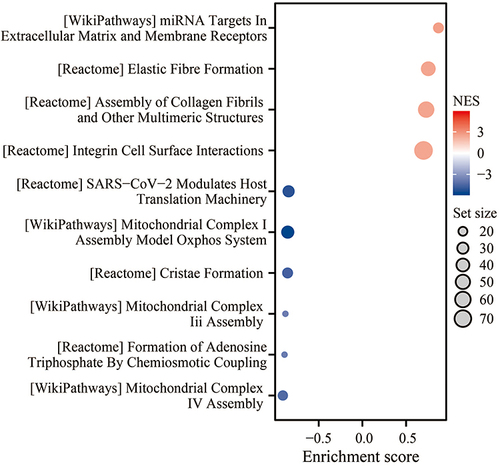
Table 3 Relationships Among Infiltration Levels of 24 Immune Cell Types and P4HA3 Expression Levels by Spearman’s Analysis
Table 4 Correlation Between P4HA3 and Immune Cell-Specific Markers in Colon Adenocarcinoma
Figure 6 Correlations of tumor immune microenvironment component scores, immune checkpoints, and immune cell infiltration with P4HA3 expression in colon adenocarcinoma (COAD) patients. (A–C) Relationships of tumor immune microenvironment component scores, including ESTIMATE scores, immune scores, and stromal scores, with P4HA3 expression levels by Spearman’s analysis. (D–F) Relationships of immune checkpoints, including CD274, CTAL4, and PDCD1, with P4HA3 expression levels by Spearman’s analysis. (G) Relationships between P4HA3 expression levels and immune cell infiltration levels based on the TIMER database. ***P<0.001.
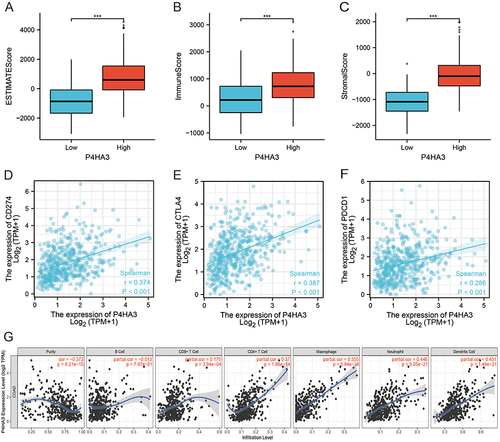
Figure 7 Relationships of P4HA3 expression with immune components including lymphocytes, immunomodulators, and chemokines in patients with colon adenocarcinoma (COAD) base on the TISIDB database. (A) Relationship between P4HA3 expression levels and lymphocytes. (B–D) Relationships between P4HA3 expression levels and immune-modulators. (E and F) Correlations between P4HA3 expression levels and chemokines.
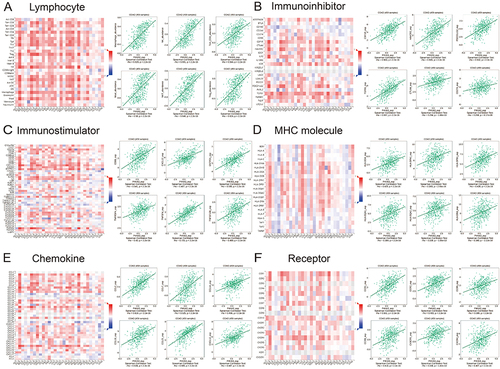
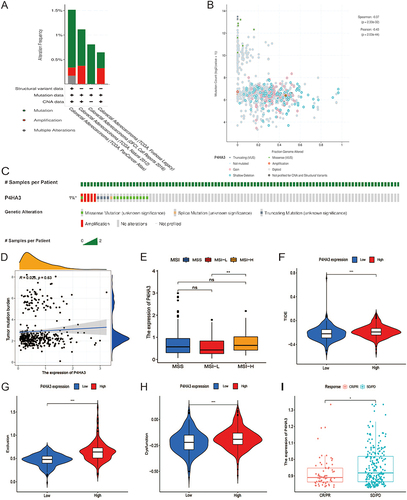
Figure 8 Analysis of P4HA3 gene mutation and its relationship with immunotherapy. (A) Alteration frequency of P4HA3 in different colon adenocarcinoma (COAD) studies. (B) Methylation level of P4HA3 based on 2129 COAD samples. (C) Percentages of alterations of P4HA3 in COAD. (D) Relationship between P4HA3 and tumor mutational burden (TMB). (E–H) Microsatellite status, TIDE score, and T cell exclusion and dysfunction scores in COAD patients with low and high P4HA3 expression. (I) Distribution of P4HA3 expression in patients with distinct responses to anti-PD-L1 treatment in IMvigor210 immunotherapy cohort. ***P<0.001; **P<0.01; *P<0.05.