
Figures & data
Table 1 RT-qPCR Primer Sequences Used in the Current Study
Figure 1 Identification of common DEIRGs and DElncRNAs from TCGA-LUAD cohort and GSE31210 dataset. (A) The volcano map of the differentially expressed genes between tumor and control samples from TCGA-LUAD cohort; (B) The expressions of top 100 DEGs in heatmap from TCGA-LUAD cohort; (C) The volcano map of the differentially expressed lncRNAs between tumor and control samples; (D) The expressions of top 100 lncRNAs in heatmap. (E) The volcano map of the differentially expressed genes between tumor and control samples from GSE31210 dataset; (F) The expressions of top 100 DEGs in heatmap from GSE31210 dataset; (G) Venn plot of overlapping DEGs in TCGA-LUAD and GSE31210 datasets; (H) Venn plot of overlapped DEGs and IRGs; (I) Venn plot of overlapping DElncRNAs in TCGA-LUAD and GSE31210 datasets.
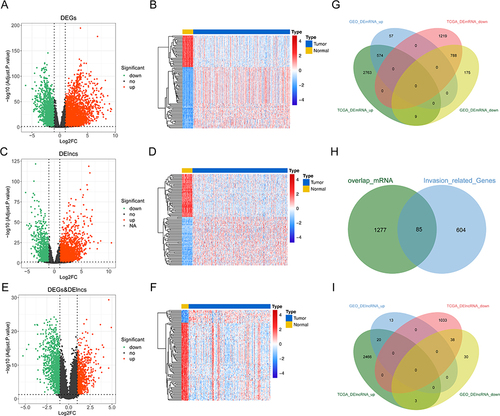
Figure 2 Identification of DEIRLs in LUAD. (A) The correlation network of DEIRGs and DElncRNAs in TCGA; (B) The correlation network of DEIRGs and DElncRNAs in GSE31210; (C) Venn plot of common DEIRLs in TCGA-LUAD and GSE31210.
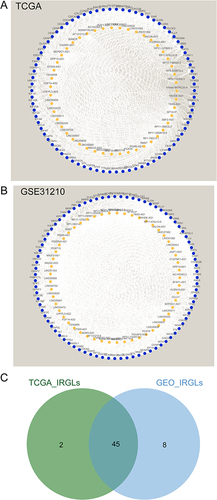
Figure 3 Identificated prognostic DEIRLs and constructed a risk score model in LUAD from the training set. (A) Univariate COX analysis of DEIRLs in forest plot; (B) Identification of risk signature by multivariate COX analysis in forest plot; (C) The expression levels of IRLs signature in tumor and control samples by RT-qPCR; (D) Relationship between risk score and clinical features. (E) The risk curve and survival status of patients in TCGA-LUAD; (F) Kaplan-Meier curves of survival in low- and high-risk; (G) Heatmap of the expressions of LINC00857, RP5-1102E8.3, RP3525N10.2 in low- and high-risk score; (H) ROC curves of the risk score model for predicting the survival of 1-, 3- and 5-year.
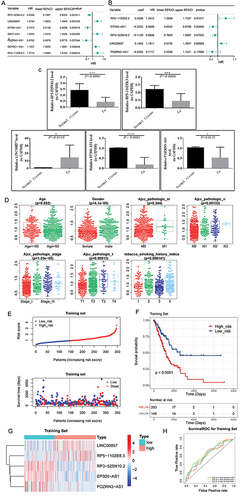
Table 2 Independent Prognostic Analyses
Figure 4 Construction of the nomogram. (A) Construction of the nomogram based on risk score, N staging and T staging for predicting the 1-, 3- and 5-year survival; (B) Calibration curves of the nomogram for 1-, 3- and 5-year; (C–E) Decision curve analysis for assessing the clinical use of nomogram in predicting the 1-, 3- and 5-year survival.
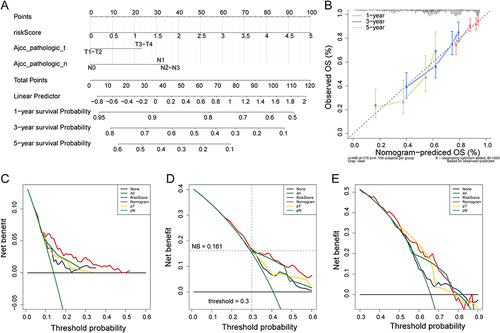
Figure 5 PCA analysis and GSEA of the high and low risk groups. (A) PCA analysis based on the expression profile of 5 prognostic IRLs; (B) PCA analysis based on the expression profile of 45 common DEIRLs; (C) PCA analysis based on the expression profile of all genes in TCGA. (D) GSEA plot of the top 10 enriched biological processes; (E) Ridge plot of the top 10 enriched biological processes; (F) GSEA plot of the top 10 enriched KEGG pathways; (G) Ridge plot of the top 10 enriched KEGG pathways.
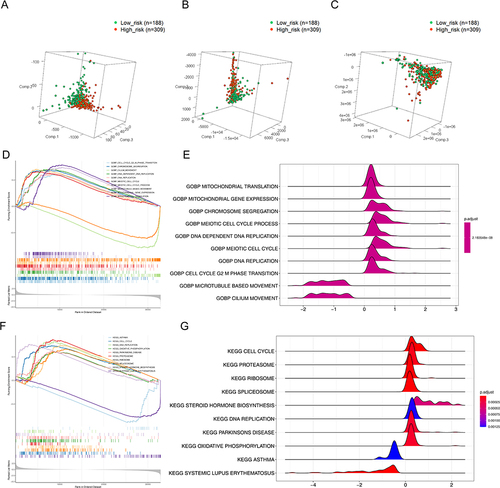
Figure 6 Comparison of chemotherapeutic sensitivity between the high- and low-risk groups. The IC50 of Docetaxel, Gefitinib, Paclitaxel, Rapamycin, Gemcitabine and Cisplatin were predicted and compared between low- and high-risk groups. ****P<0.0001, ns P>0.05.
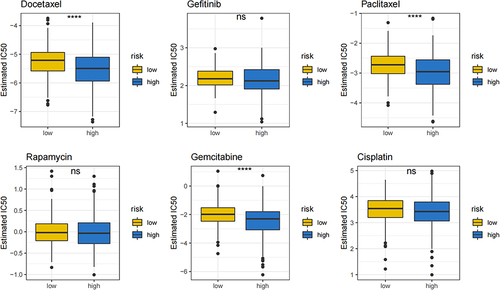
Figure 7 Build a ceRNA network. (A) The volcano map of the differentially expressed miRNA between tumor and control samples; (B) The expressions of top 100 miRNA in heatmap; (C) The prognostic lncRNA-related ceRNA network; (D) The prognostic lncRNA-invasion-related DEmRNA-DEmiRNA extracted from the ceRNA network.
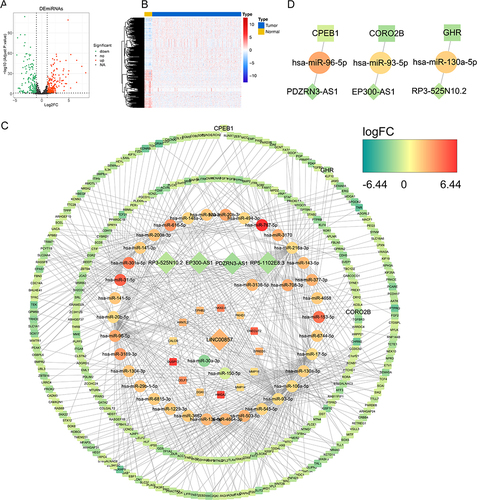
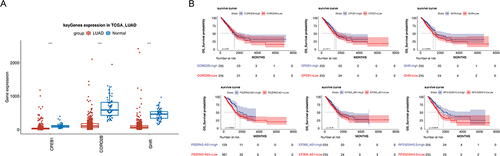
Figure 8 Analysis of ceRNA network. (A) Expression of CPEB1, CORO2B, and GHR in LUAD and NC samples. (B) Kaplan–Meier survival curves in the high- and low-expression groups of three prognostic lncRNAs and three DEmRNAs.
Data Sharing Statement
The data that support the findings of this study are available from the corresponding author upon reasonable request.