
Figures & data
Figure 1 TIGIT expression in pan-cancer tissues and Kaplan-Meier survival curves of BC patients. (A) TIGIT level in pan-cancer tissues and normal tissues. (B) TIGIT expression in invasive BC tumor tissue (TT) versus adjacent normal tissue (NT). (C) Relationship between TIGIT expression and BC stage. (D and E) Recurrence-free survival (RFS) and overall survival (OS) of BC patients with high-level TIGIT versus low-level TIGIT, respectively.
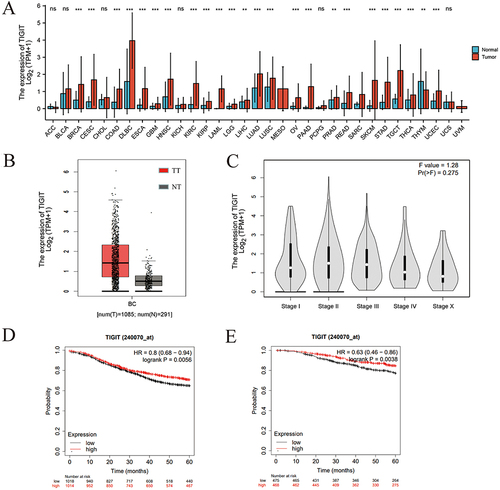
Table 1 TIGIT Expression in Tumor Tissues and Adjacent Tissues
Figure 2 Protein (A and B) and mRNA (C) expressions of TIGIT in BC cell lines (ie MCF-7 and MDA-MB-231) and human normal breast epithelial cell line (MCF-10A). (A) is WB bands; (B and C) are quantitative analysis of protein and mRNA levels, respectively. TIGIT level in two BC cell lines is expressed as multiples of that in normal cell line. *P < 0.05 and **P < 0.01 versus normal cell line.
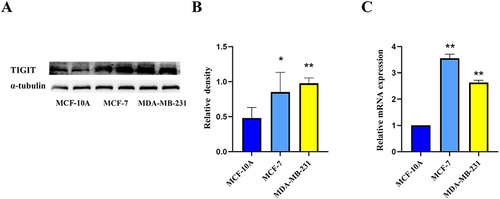
Figure 3 TIGIT expression in tumor tissues based on IHC (A, 200× and B, 400×) versus adjacent tissues (C, 200× and D, 400×).
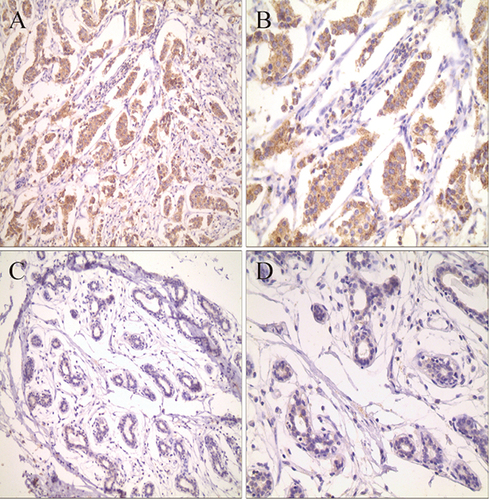
Figure 4 Representative immunofluorescence microscopic images of TIGIT, CD3, and CD56 in BC tissues and adjacent tissues.
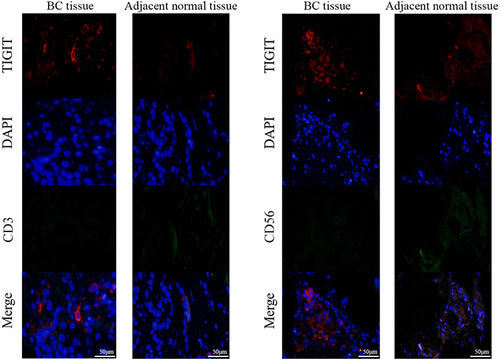
Figure 5 Flow cytometry histograms of CD3+ and TIGIT+ T cells in PBC patients (A and B) versus healthy controls (C and D).
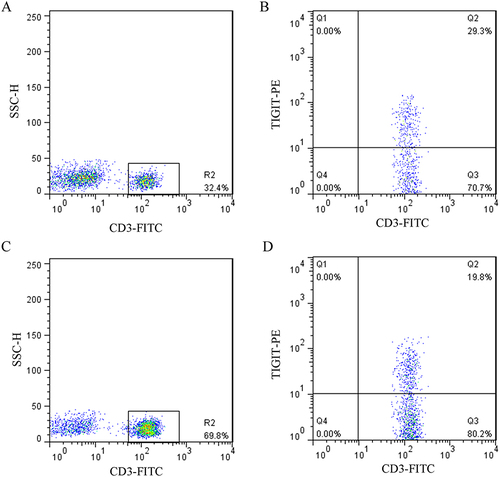
Figure 6 Comparison of TIGIT expression between two groups and the sensitivity of TIGIT for the diagnosis of PBC. (A) TIGIT level (%) on CD3+ T cells in PBC patients versus healthy controls. (B) The ROC curve drawn based on the percentage of TIGIT in peripheral blood T cells of PBC patients.
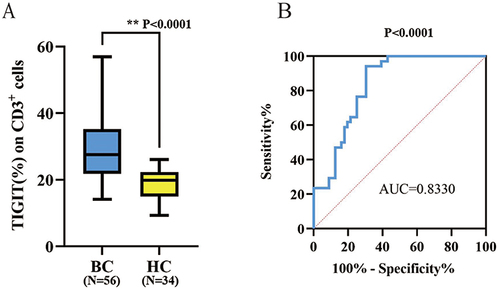
Figure 7 Flow cytometry histograms of TIGIT level in peripheral blood of preoperative (A and B) versus postoperative (C and D) PBC patients.
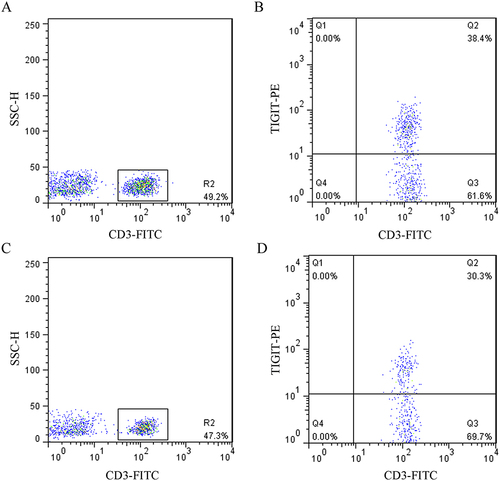
Figure 8 TIGIT level in peripheral blood of preoperative versus postoperative PBC patients.
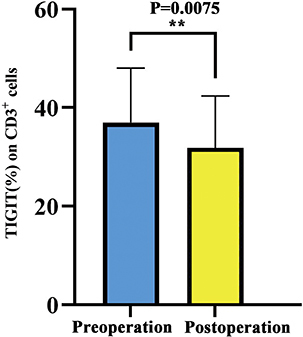
Table 2 Correlation Between TIGIT Level on Peripheral Blood T Cells and Clinicopathological Features in PBC Patients