Figures & data
Figure 1 Pedigrees of the six family and Sanger sequencing. (A) Pedigree of No.1 patient, M1 (c.1096–2A>G) was de novo, M2 (c.1862A>G) was inherited from father. (B) Pedigree of No.2 patient, M1 (c.506–1G>A) and M2 (c.2747+4del) were inherited from the mother and father, respectively. (C) Pedigree of No.3 patient, M1 (c.602–16G>A) and M2 (c.965–1_976delinsACCGAAAATTTT) were inherited from the mother and father, respectively. (D) Pedigree of No.4 patient, M1 (c.533C>T) and M2 (c.602–16G>A) were inherited from the mother and father, respectively. (E) Pedigree of No.5 patient, mutation (c.1456G>A) was inherited from her mother and father. (F) Pedigree of No.6 patient, M1 (c.1108G>C) was de novo, M2 (c.1456G>A) was inherited from father. Males and females are indicated by squares and circles. An affected individual is indicated by filled black and carrier filled in half black. The black arrow indicates the proband and red arrow indicates the location of the Sanger sequencing of the mutations. An asterisk refers to a de novo mutation. N stands for normal sequencing and WT stands for wild type. M1 and M2 represent mutation 1 and mutation 2.
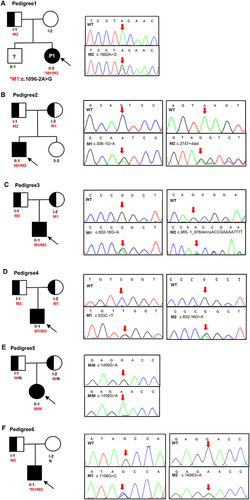
Table 1 RT-PCR Primer Information
Table 2 Clinical Characteristics of Six Patients with GS
Table 3 Genetic Analysis of Six Patients with GS
Figure 2 Schematic overview of SLC12A3 gene and representation of intronic variants on pre-RNA splicing in patients with GS. (A) The structure of SLC12A3 and its 26 exons which are indicated by black vertical lines. The black arrows in the diagram indicate the position of nine variations. Mutations that have been reported are shown in black, and those novel mutations in the manuscript are indicated by red. (B) Schematic overview of the region harboring c.1096–2A>G mutation in SLC12A3 and representation of the abnormal splicing. Representation of the alternative splicing of exon 9 in SLC12A3. Electrophoresis for amplification of SLC12A3 cDNA from the WT and No.1 patient (MT1). (C) Schematic overview of the region harboring c.2747+4del mutation in SLC12A3 and representation of the abnormal splicing. Representation of the alternative splicing of exon 23 in SLC12A3. Electrophoresis for amplification of SLC12A3 cDNA from the WT and No.2 patient (MT2). Red arrows indicate the position of MT and WT in agarose gel. WT represents wild-type and MT represents mutant type.
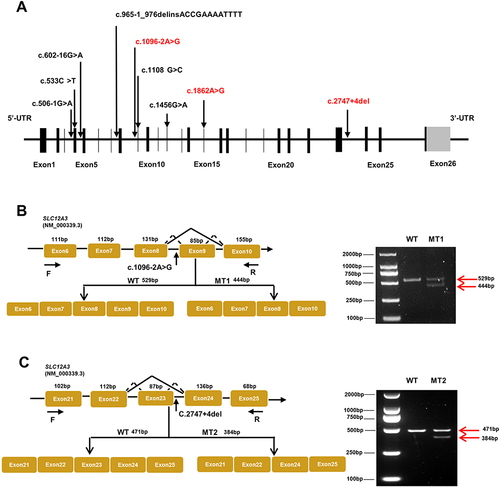
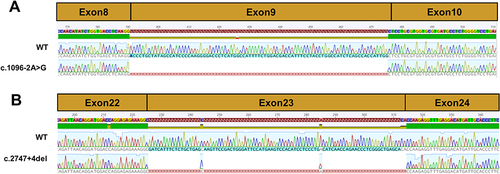
Figure 3 Sequencing chromatogram of SLC12A3 wild-type cDNA and splice variants. (A) The normal splicing fragment between exon 8 and 10; aberrant transcript of c.1096–2A>G skipping of exon 9. (B) The normal splicing fragment between exon 22 and 24; aberrant transcript of c.2747+4del skipping of exon 23.