Figures & data
Figure 1 Differential mRNA expression profiles in hepatocellular carcinomas (HCCs) patients stratified by MARCKS levels. (A) The expression of MARCKS in different tumor types and pericancerous tissues was compared based on TCGA database. (B) The expression of MARCKS in hepatocellular carcinoma was higher than that in pericancerous tissues. (C) qPCR was used to detect the expression of MARCKS in 8 groups of HCCs and adjacent normal tissues. The high- and low- MARCKS DEGs expression groups were shown by volcano plots (D). The represented DEGs are presented with heatmaps (E). ns, P ≥ 0.05; *P < 0.05; **P < 0.01; ***P < 0.001.
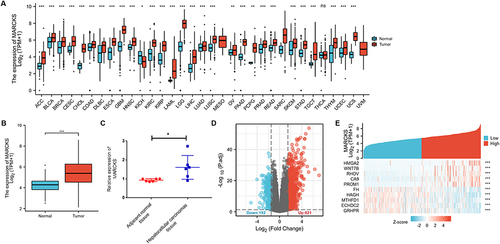
Figure 2 Functional annotation of differentially expressed genes (DEGs) in hepatocellular carcinomas (HCCs) patients with distinct MARCKS levels. (A) Enrichment pathway of MARCKS-related DEGs in Metascape. (B) Representative terms were present in a network layout, such as NABA MATRISOME ASSOCIATED, embryonic morphogenesis. (C) The same enrichment network presents nodes colored by the P-value. (D–O) Enrichment analysis of representative gene sets of MARCKS-related DEGs.
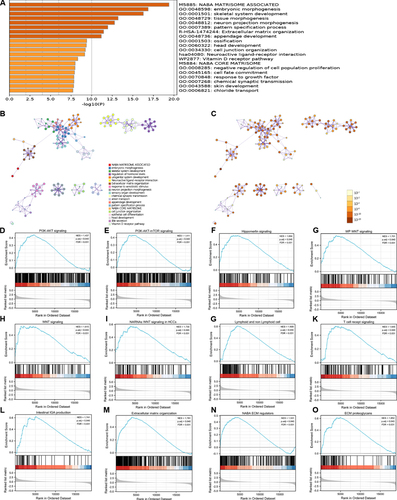
Figure 3 Correlation of immune cell infiltration and MARCKS expression in hepatocellular carcinomas (HCC) patients. (A) Spearman analysis was used to explore the correlation between the infiltration level of 24 immune cells and the expression of MARCKS. Compare the Th2 (B), TFH (C), T helper (D), macrophages (E), Th1 (F), T (G), iDC (H), NK CD56+ (I), B (J), Tem (K), aDC (L) and Th17 (M) cells infiltration levels between the high and low MARCKS expression groups.
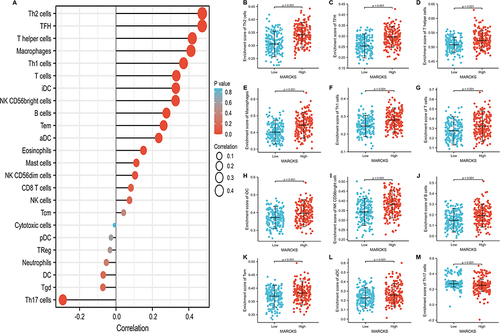
Table 1 Clinicopathological Characteristics of HCCs Patients with Differential MARCKS Expression
Table 2 Logistic Regression Analysis of Association Between Clinicopathological Characteristics and MARCKS Expression in HCCs Patients
Figure 4 MARCKS expression is associated with clinicopathological characteristics in hepatocellular carcinoma (HCCs) patients. The Wilcoxon rank sum test was applied to analyze the association of MARCKS expression with weight (A), age (B), AFP level (C), tumor status (D), pathologic stage (E), Histologic grade (F), clinical T stage (G), and fibrosis ishak score (H).
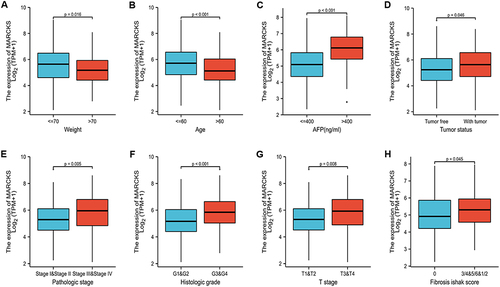
Figure 5 The predictive value of MARCKS in the diagnosis and clinical outcome of patients with hepatocellular carcinomas (HCCs). (A) ROC curve analysis evaluating the performance of MARCKS for HCCs diagnosis. Kaplan–Meier analysis compares the differences in overall survival (OS) (B), progression-free survival (PFS) (C), and disease-specific survival (DSS) (D) between the high and low MARCKS expression groups.
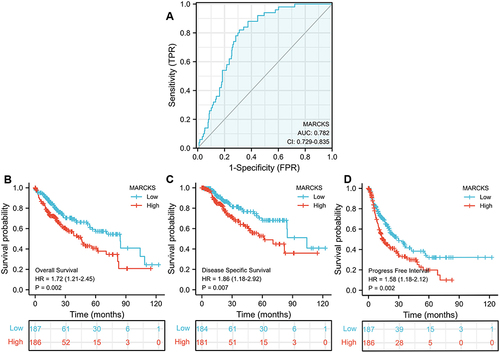
Table 3 Cox Regression Analysis for Clinical Outcomes in HCCs Patients
Figure 6 Construction and validation of nomograms based on MARCKS expression. A nomogram constructed based on the risk score model of MARCKS expression was established for 1, 3, and 5 years overall survival (A), progression-free survival (C), and disease-specific survival (E). The calibration chart verifies the efficiency of the nomogram for overall survival (B), progression-free survival (D), and disease-specific survival (F).
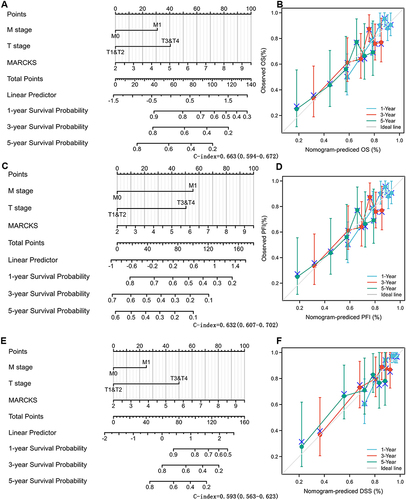
Table 4 Prognostic Performance of MARCKS on Clinical Outcomes (OS, PFS and DSS) in HCCs Patient Subgroups by Cox Regression Analysis
Figure 7 Prognostic performance of MARCKS on clinical outcomes in different HCCs patient subgroups. According to the clinicopathological characteristics of HCC patients, they are divided into different subgroups. Cox regression was used to evaluate the prognostic performance of MARCKS for each subgroup overall survival (A), progression-free survival (B) and disease-specific survival (C), and the results were expressed as a hazard ratio. The bar represents the 95% confidence interval of the hazard ratio, and the size of the diamond represents the significance of MARCKS performance.
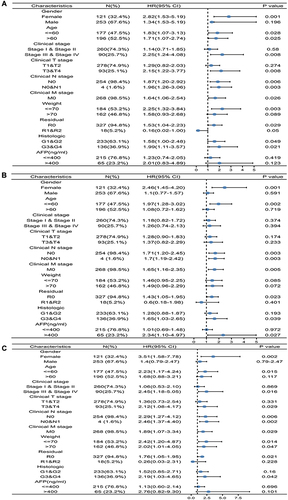
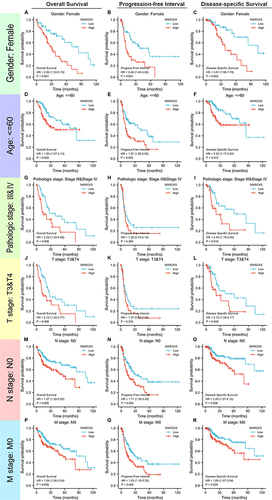
Figure 8 Distinct clinical outcomes based on MARCKS expression in hepatocellular carcinomas (HCCs) patient subgroups. Kaplan–Meier analysis showing the comparison of overall survival (A, D, G, J, M and P), progression-free survival (B, E, H, K, N and Q), and disease-specific survival (C, F, I, L, O and R) between high- and low-MARCKS expression groups in several HCCs patient subgroups, including male gender (A–C), age below 60 years (D–F), pathologic stage II–IV (G–I), T stages T1–T2 (J–L), N stage (M–O) and M stage (P–R).