Figures & data
Figure 1 GBP5 expression and survival prognosis in NSCLC. (A) GBP5 mRNA expressions in NSCLC from TCGA. (B) GBP5 protein expressions in LUAD from CTPAC. (C) Representative images revealing GBP5 expression in tumor and para-cancer tissues in NSCLC. Magnification, 200×. (D) Immunohistochemistry of GBP5 in NSCLC and para-cancer tissues. (E and F) NSCLC patients with high GBP5 expression had better OS and PPS in NSCLC versus those with low GBP5 expression.
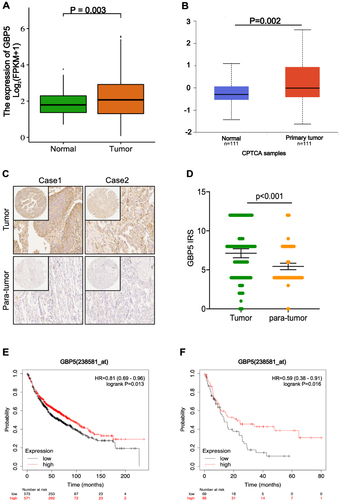
Figure 2 GBP5 predicts a tumor immune microenvironment in NSCLC. (A) Correlation of different expression levels of GBP5 with immunomodulators in NSCLC. (B) Correlation between GBP5 expression and tumor purity in NSCLC. (C) TIMER and EPIC algorithms were used to calculate the correlation between GBP5 expression and the level of TIICs. The color and values represent the Pearson correlation coefficient. (D) Correlation of different expression levels of GBP5 with inhibitory and stimulatory immune checkpoints in NSCLC.
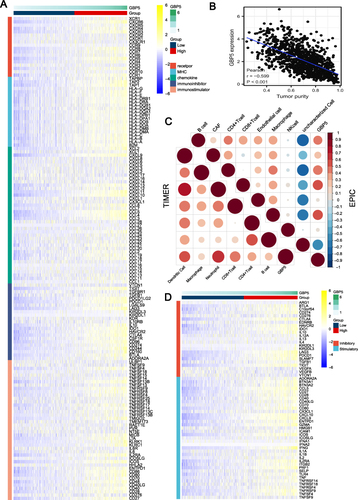
Figure 3 Validation of the predictive value of GBP5 and its correlation with PD-L1. (A) Differences in levels of IPS in the high and low GBP5 groups in NSCLC. (B) Correlation between GBP5 and T cell inflamed score in NSCLC. (C) Representative images reveal PD-L1 expression in the high and low GBP5 groups. Magnification, 200×. (D) Differences in PD-L1 expression between the high and low GBP5 groups. (E) Correlation between GBP5 and PD-L1 expression in the NSCLC TMA cohort.
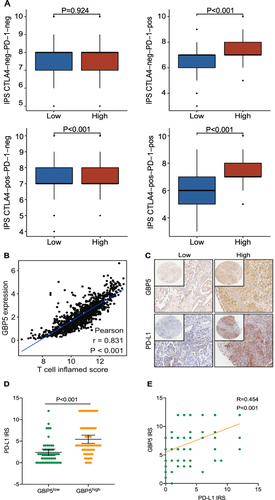
Table 1 The Relationship Between GBP5 Expression in NSCLC Patients
Figure 4 GBP5 predicts the immunotherapeutic response of immunotherapy. (A) Expression levels of GBP5 in the GSE26044 cohort from patients with different responses. (B) Comparison of GBP5 and PD-L1 predictive values for immunotherapy in the GSE26044 cohort. (C) Correlation between GBP5 expression and immunomodulatory molecules.
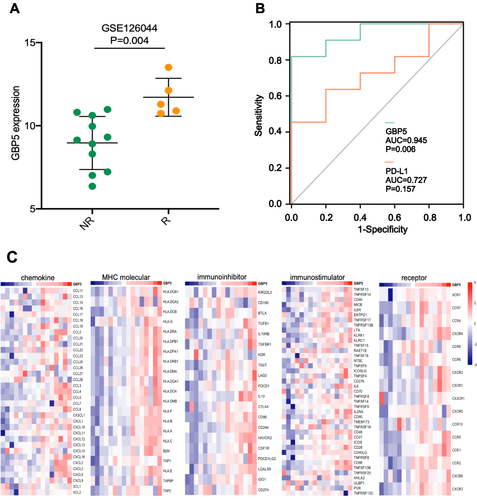
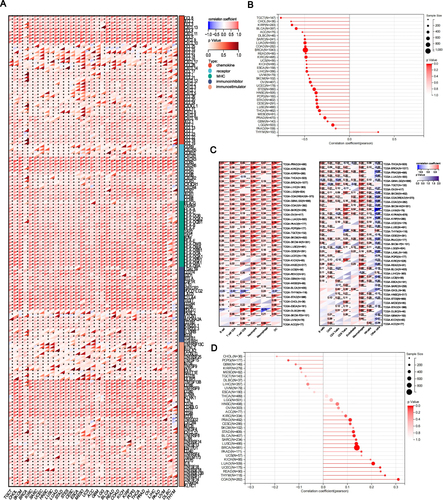
Figure 5 Across cancer types of analysis of immunological correlations of GBP5. (A) Correlations between GBP5 and immunomodulators across cancer types. The color indicates the correlation coefficient. The asterisks indicate P values: *P<0.05. (B) Correlation between GBP5 and tumor purity across cancer types. (C) Correlations between GBP5 and TIICs estimated by TIMER and EPIC algorithms across cancer types. The color indicates the correlation coefficient. The asterisks indicate P values: *P<0.05; **P<0.01; ***P<0.001; ****P<0.0001. (D) Correlation between GBP5 expression and TMB levels across cancer types.