
Figures & data
Figure 1 A 28-year-old female patient with synovial sarcoma in the left thigh. The tumor had a heterogeneous signal on sagittal T2W (A) and sagittal T1W (B) and included a cystic component that appeared hyperintense on T2W (A) and hypointense on T1W (B) and a hemorrhagic component that showed a hyperintense signal on T1W (B). Peritumoral edema manifested as hyperintensity on STIR (C). The tumor had a multilobulated margin, a relatively well-defined border with surrounding structures, and many septa inside (D). The necrotic part of the tumor comprised the hypointense portion on T1W images (E), without enhancement after injection (F). The tumor was in contact with the femoral bone but without cortical erosion, bone marrow edema, and involvement of the femoral great vessel on T1 C+ (F).
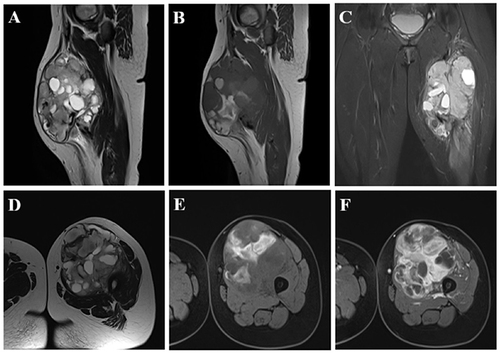
Figure 2 Illustration of how to measure quantitative indicators. (A) Tumor size was calculated based on the maximum length of the tumor. Roundness was the ratio of the maximum width to the length of the tumor (measured on the respective axis). (B–D) Illustration showing how to place the ROI of the tumor signal on axial T1W (B), T2W (C), and contrast-enhanced T1W (D).
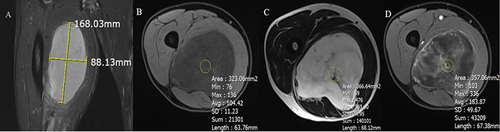
Table 1 Histological Types of Included Soft Tissue Tumors
Table 2 Qualitative Values of Benign and Malignant Soft Tissue Tumors
Table 3 Quantitative Values of Benign and Malignant Soft Tissue Tumors
Table 4 Comparison of Univariate and Multivariate Models for the Differentiation Variable