Figures & data
Figure 1 mRNAs expression profile in rNPC tissues compared to normal tissues. (A) Heat maps with hierarchical clustering analysis show 30 differentially expressed mRNAs (15 up-regulated and 15 down-regulated mRNAs) on the RNA-seq analysis. The histogram on the upper right is in color order. The color change from top to bottom indicates high-to-low mRNA expression in the sample; (B) Volcano plots of the differentially expressed mRNAs. Horizontal dotted line: q=0.05 (–log10 scaled); red points: upregulated mRNAs with statistical significance; green points: downregulated mRNAs with statistical significance; (C) Representative imaging of IHC showing the expression of Lgr5 in the rNPC, primary NPC and normal tissue samples (original magnification×200); (D) IHC staining score of Lgr5 was significantly higher in the rNPC tissues, compared to the primary NPC tissues and the normal tissues; (E) Representative imaging of IHC showing expression of Lgr5 in different T stages of rNPC. (F) Western blotting showed the expression of Lgr5 in 6 pairs of rNPC and non-cancer tissues.
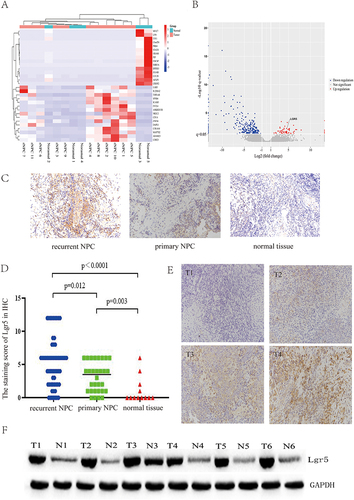
Table 1 Correlation Between Lgr5 and Clinical Characteristics in 60 rNPC Patients
Table 2 Univariate and Multivariate Cox Regression Analyses of OS in Patients with rNPC
Table 3 Univariate and Multivariate Cox Regression Analyses of DFS in Patients with rNPC
Figure 2 Kaplan-Meier curve pertaining to the survival in patients with rNPC. (A) Overall survival; (B) Disease-free survival.
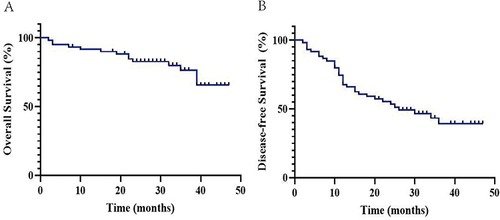
Figure 3 Kaplan-Meier curves pertaining to the OS in patients with rNPC. (A) Lgr5 expression (high expression vs Low expression); (B) T stage (T1+T2 vs T3+T4); (C) Tumor necrosis; (D) Gender; (E) age (<50 vs ≥50); (F) Smoking history; (G) Drinking history; (H) Histological type; (I) Lymph node metastasis.
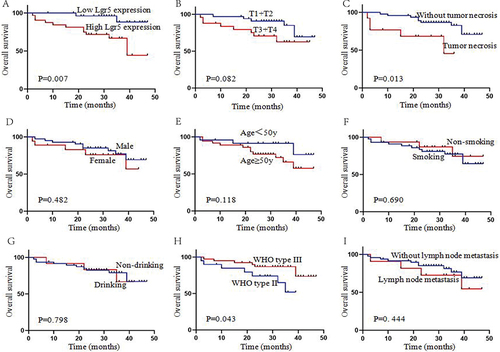
Figure 4 Kaplan-Meier curves pertaining to the DFS in patients with rNPC. (A) Lgr5 expression (High expression vs Low expression); (B) T stage (T1+T2 vs T3+T4); (C) Tumor necrosis; (D) Gender; (E) age (<50 vs ≥50); (F) Smoking history; (G) Drinking history; (H) Histological type; (I) Lymph node metastasis.
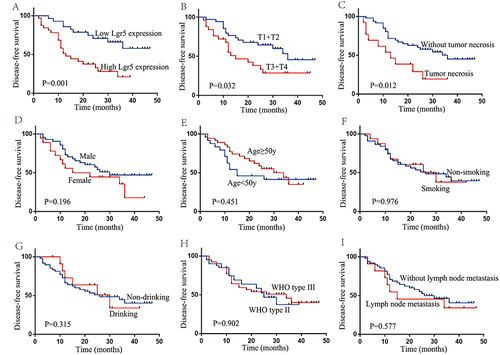
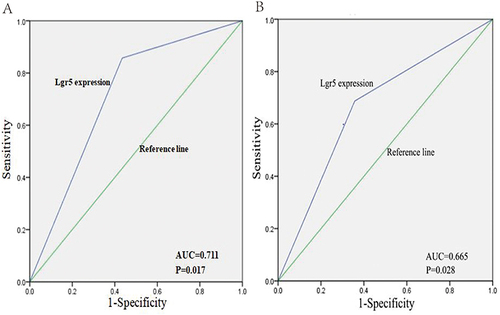
Figure 5 Receiver operating characteristic analysis revealed that Lgr5 expression had good predictive value as a predictor of survival and recurrence in rNPC patients. The area under the ROC curve was 0.711 (A) (P=0.017) and 0.665 (B) (P=0.028), respectively.