Figures & data
Figure 1 Overexpression of NRP1 was associated with HNSCC progression. (A) Representative diagram of NRP1 staining level on 202 HNSCC patient tissue samples and normal oral mucosa epithelial (left: 100 μm; right: 25 μm). (B) Comparison of NRP1 expression levels in HNSCC tissues and normal tissues. (C) Comparison of NRP1 expression levels in different tumor size (T stage). (D) Comparison of NRP1 expression levels in different lymph node status (N stage). (E) Comparison of NRP1 expression levels between recurrence and non-recurrence.
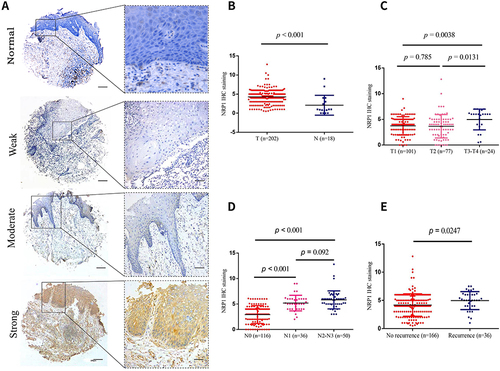
Table 1 Expression of NRP1 and its associations with clinicopathological characteristics in 202 patients with HNSCC
Figure 2 High level NRP1 expression indicates poor prognosis in HNSCC patients. (A) Kaplan–Meier analysis of overall survival based on NRP1 expression of HNSCC. (B) Kaplan–Meier analysis of disease-free survival based on NRP1 expression of HNSCC. (C) Univariate Cox proportional hazards regression analysis of patients with HNSCC. (D) Multivariate Cox proportional hazards regression analysis of patients with HNSCC.
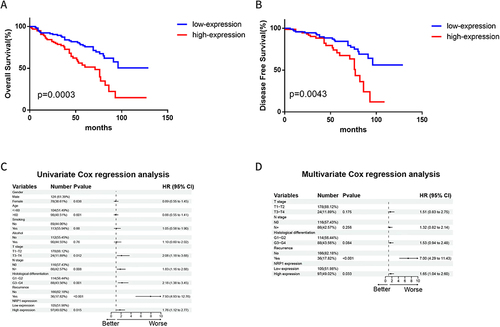
Figure 3 The mRNA expression analysis of NRP1 in HNSCC from TCGA. (A) NRP1 mRNA expression between normal tissues and HNSCC subtypes tissues were compared using two-tailed student-t test. *p < 0.05. (B) The volcano figure of differentially expressed genes between low and high expression of NRP1 in HNSCC. (p < 0.05, log2 (fold-change) >1.5). (C) The top 20 genes significantly related to NRP1 expression in HNSCC tissues based on the value of correlation coefficient (R) as shown in heatmap. (D) Bubble chart show the Gene Ontology (GO) enrichment of differential expression genes in HNSCC. (E) The concept network shows the top 5 Kyoto Encyclopedia of Genes and Genomes (KEGG) pathway according to differential expression genes in HNSCC.
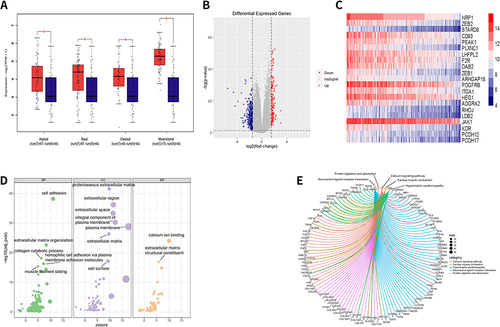
Figure 4 The correlations between NRP1 mRNA expression and the level of immune infiltration. (A) GSEA analysis for the correlations between the immunological memory formation process, cytokine production involved in immune response, negative regulation of immune response and the levels of NRP1 mRNA in HNSCC according to the TCGA database. (B and C) Immune infiltration assessment of HNSCC between different NRP1 expression using CIBERSORT algorithm. (D) Correlations between NRP1 mRNA expression and immune checkpoint markers. (E) Heatmap exhibited the expression level of NRP1 and immune cells biomarkers in HNSCC. (F) The TIDE algorithm indicated significantly lower responsiveness in NRP1 high expression patients. *P < 0.05, **P < 0.01, ***P < 0.001.
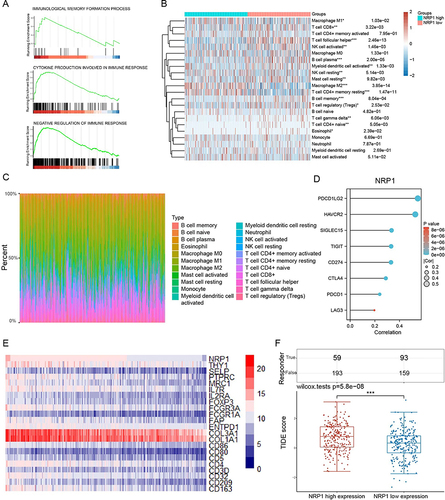
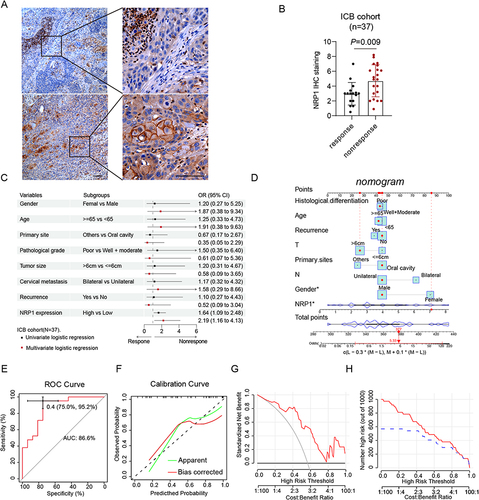
Figure 5 NRP1 might be a hopeful indicator in predicting the immunotherapy effect. (A) The representative images of NRP1 staining in different immunotherapy response patients. (B) NRP1 is high expression in immunotherapy nonresponsive patients. (C) Univariate and multivariate logistic regression analysis of different response immunotherapy patients is shown in forest plot. (D) The constructed nomogram for predicting the immunotherapy response of HNSCC patients. (E) The AUCs are 0.866 in the immunotherapy cohort. (F) The calibration plots indicate good agreement between the predicted probabilities and the actual results. (G) DCA curves indicate the net benefit of the model in the immunotherapy cohort. (H) CIC curves indicate the predictive value of the model in the immunotherapy cohort.