Figures & data
Figure 1 Comparison of FAM111B expression in different tumors and adjacent normal tissues. (A)The expression level of FAM111B in different tumors or their subtypes and corresponding normal tissues was analyzed using the TCGA dataset. (B)The expression status of FAM111B in various tumors in the TCGA dataset was examined by including relevant normal tissues from the GTEx database as controls. (C)The expression of FAM111B in total protein between primary tumor and normal tissues of six different cancers was analyzed based on the CPTAC dataset. *P < 0.05, **P < 0.01, ***P < 0.001.
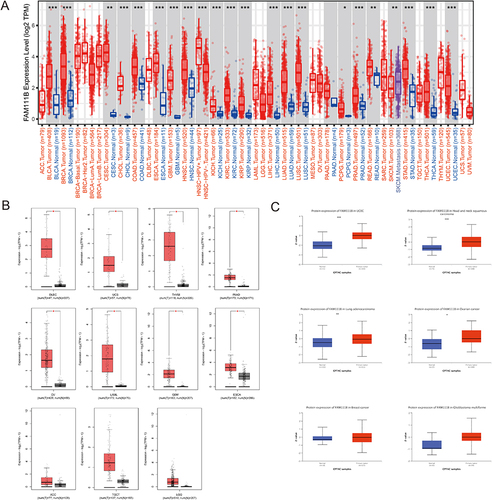
Figure 2 Analysis of FAM111B expression in different pathological stages of various cancers in TCGA. (A) The expression difference of FAM111B gene in cancer categories with significant difference in various pathological stages. (B) The expression difference of FAM111B gene in cancer categories with insignificant expression difference in various pathological stages.
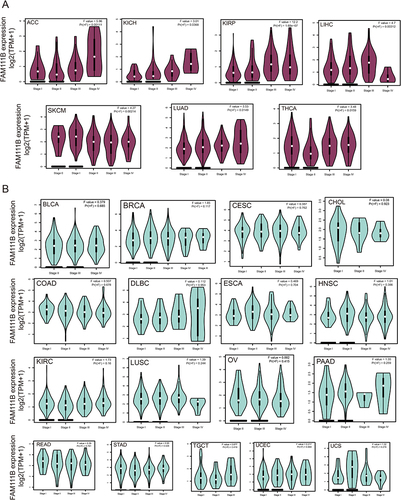
Figure 3 Analysis of FAM111B expression associated prognosis in different cancers. (A) Analysis of overall survival (OS) between FAM111B expression and various cancers, Kaplan-Meier curves demonstrate that significant difference between high and low expression of FAM111B and OS in some cancers; (B) Analysis of disease-free survival (DFS) between FAM111B expression and various cancers, Kaplan-Meier curve demonstrates that significant difference between high and low expression of FAM111B and DFS in some cancers.
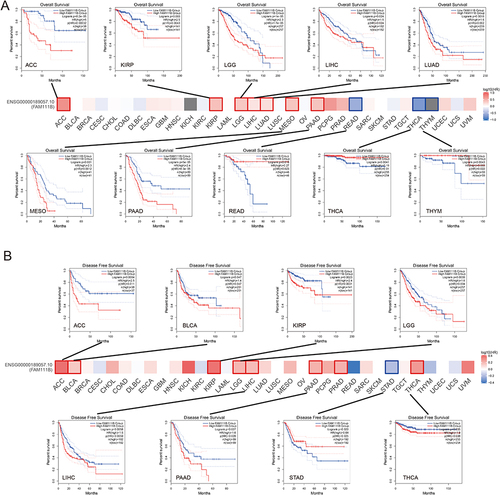
Figure 4 Analysis of ROC curves between FAM111B and tumor prediction based on data from TCGA and GTEx databases.
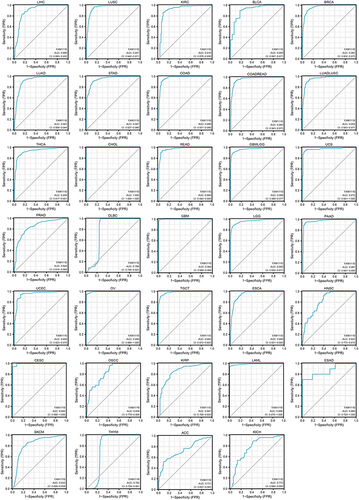
Figure 5 Mutation levels of FAM111B in different tumors. (A) Analysis of FAM111B mutation frequency in the TCGA pan-cancer study via cBioPortal database. (B) General mutation counts of FAM111B in various TCGA cancer types via cBioPortal database. (C) Mutation map of FAM111B in different cancer types across protein domains.
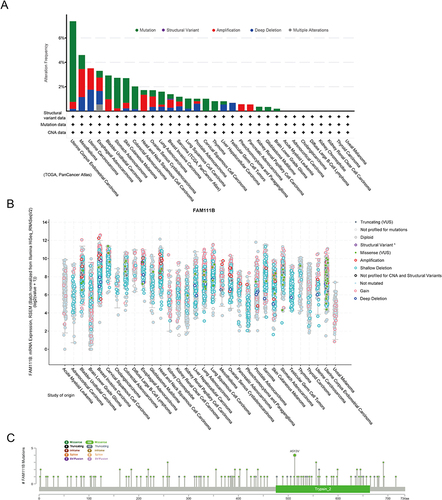
Figure 6 Correlation analysis between FAM111B expression and CAFs. (A) Heatmap of the correlation between FAM111B and the tumor-related immune infiltration level of CAFs among all cancers in TCGA with diverse type of algorithms. (B) Correlation analysis of between FAM111B expression and CAFs in BRCA, STAD, TGCT and TGCT.
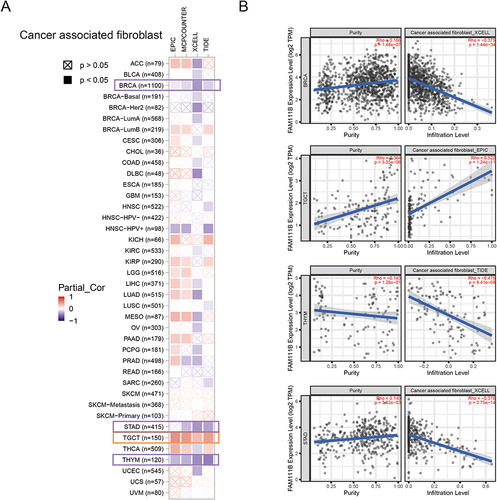
Figure 7 Correlation analysis between FAM111B expression and CD8+ T-cell infiltration. (A) Heatmap of the correlation between FAM111B and the tumor-related immune infiltration level of CD8+ T-cells among all cancers in TCGA with diverse type of algorithms. (B) Correlation analysis of between FAM111B expression and CD8+ T-cell infiltration in HNSC-HPV, KIRC, THYM and UVM.
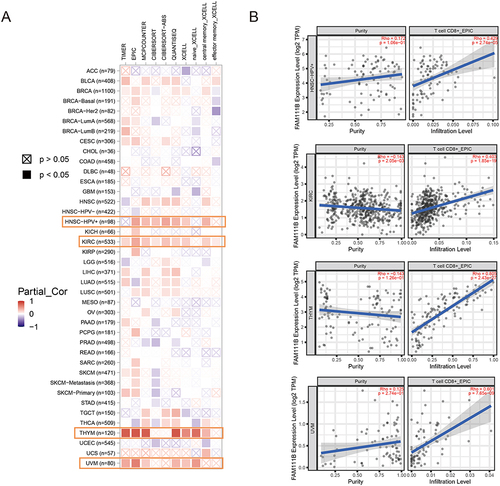
Figure 8 Pan-cancer Spearman analysis of tumor heterogeneity and FAM111B expression. (A) Correlation analysis between TMB and FAM111B expression levels; (B) Correlation analysis between MSI and FAM111B expression levels; (C) Correlation analysis between MATH and FAM111B expression levels; (D) Correlation analysis between purity and FAM111B expression levels; (E) Correlation analysis between tumor ploidy and FAM111B expression level; (F) Correlation analysis between tumor HRD and FAM111B expression level; (G) Correlation analysis between NEO and FAM111B expression level; (H) Correlation analysis between LOH and FAM111B expression level.
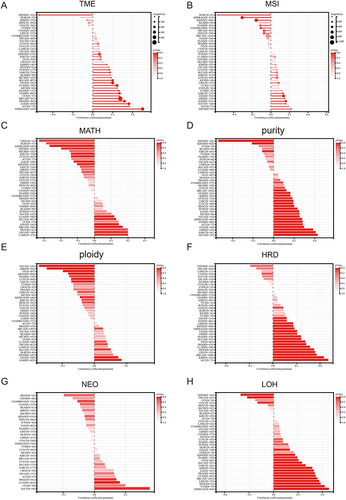
Figure 9 FAM111B-related gene enrichment analysis. (A) Gene Ontology (GO) analysis of the top 100 genes co-expressed with FAM111B obtained by GEPIA2. (B) Co-expression network of 50 genes co-expressed with FAM111B obtained by the STRING tool. (C) 20 genes most closely related to FAM111B obtained by GeneMANIA website. (D) FAM111B–protein interactions obtained by BioGRID. (E−J) Correlation analysis between FAM111B and SET, HIST1H1E, MED, ITGB1, EXOSC9, DTX2, BAG3 and ATP13A2 conducted by GEPIA2 across all tumor samples in TCGA.
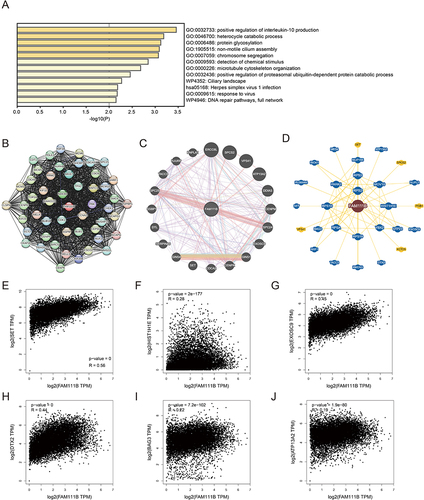
Table 1 Correlation Between FAM111B Expression and GC Clinicopathological Parameters
Table 2 Univariate Analyses of Prognostic Factors for Recurrence-Free Survival
Table 3 Multivariate Analyses of Prognostic Factors for Recurrence-Free Survival
Figure 10 The expression of FAM111B in human GC tissues and the relationship with the prognosis of GC patients. (A) qRT-PCR analysis of FAM111B expression in human GC tissues and corresponding paracancerous normal tissues. (B) The relationship between the expression of FAM111B and the recurrence-free survival of GC patients. ***P < 0.001.
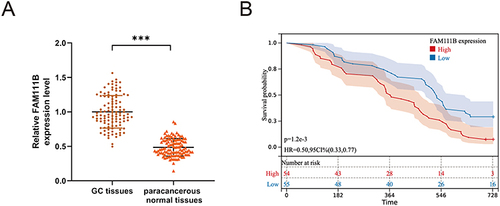
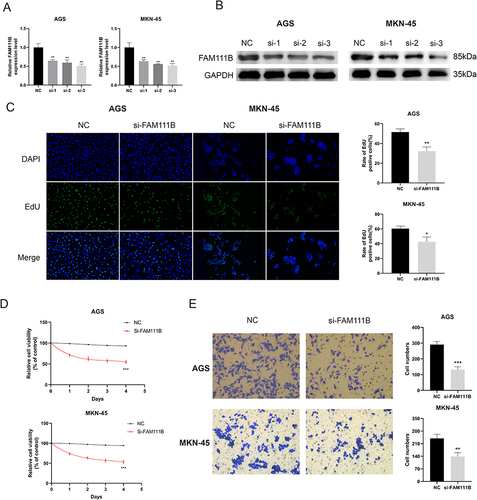
Figure 11 Knockdown of FAM111B inhibits the proliferation and migration of GC cells. (A and B) AGS and MKN-45 cells were transfected with negative control (NC) or siRNA targeting FAM111B (si-1, si-2, si-3) for 48 h. qRT -PCR and Western blot were used to measure the silencing efficiency of siFAM111B in AGS and MKN-45 cells. (C) AGS and MKN-45 cells were transfected with NC or si-FAM111B for 24 h and cell proliferation was assessed by EdU incorporation assay. The percentage of EdU positive cells was quantified. (D) After transfection, AGS and MKN-45 cells were continued in the medium at specified time points, and cell proliferation was assessed by CCK8 assays. (E) Cell migration was analyzed in AGS and MKN-45 cells transfected with NC or si-FAM111B by transwell assay. The number of cells in the chamber was quantified. *P < 0.05, **P < 0.01, ***P < 0.001.