Figures & data
Table 1 Clinical Baseline Characteristics of the NSCLC Group and the Healthy Controls
Figure 1 The levels of MAR and NPHR among I A–II B stage, III A-IV stage of NSCLC and the healthy controls. (A) MAR and (B) NPHR.***P<0.001.
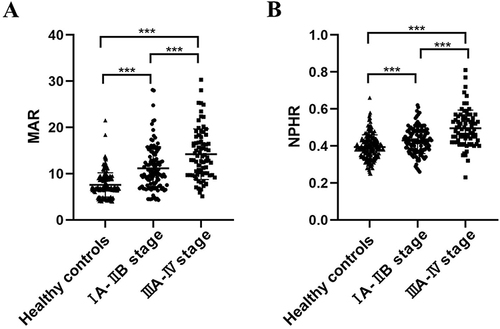
Table 2 Associations Between MAR and NPHR Levels and Clinicopathological Features in the NSCLC Group
Table 3 Diagnostic Efficiency of MAR, NPHR, Alone or Combined, in the NSCLC Patients and the Healthy Controls
Figure 2 (A) ROC curve analysis of the value of MAR, NPHR and CEA alone in the diagnosis between the NSCLC group and the healthy controls. (B) ROC curve analysis of the value of MAR, NPHR and CEA combined in diagnosis between the NSCLC group and the healthy controls.
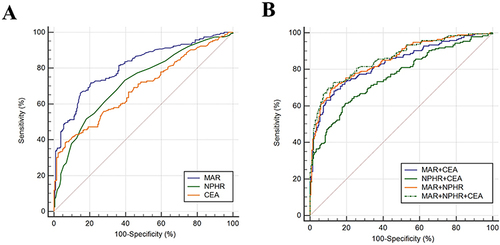
Table 4 Binary Logistic Regression Analysis of Potential Risk Factors for NSCLC
Table 5 Diagnostic Efficiency of MAR and NPHR, Alone or Combined in the Early-Stage NSCLC Group and the Healthy Controls
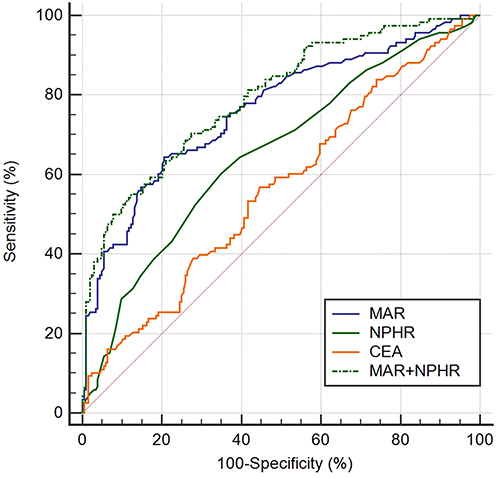
Figure 3 ROC curve analysis of the value of MAR, NPHR and CEA alone or combined in diagnosis between the early-stage NSCLC group and the healthy controls.