
Figures & data
Figure 1 Flowchart of the inclusion and exclusion criteria.
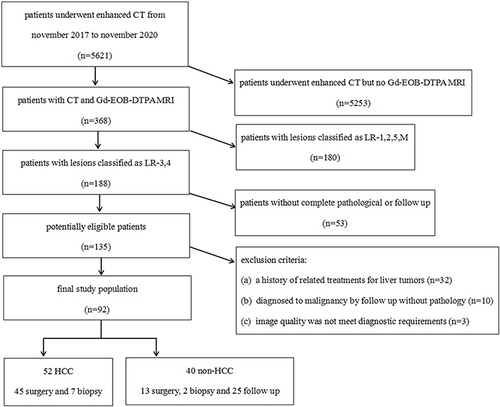
Table 1 Characteristics of the Study Population
Table 2 Tumor Features of LI-RADS
Figure 2 56-year-old man with cirrhosis and HCC. (a) APHE of Gd-EOB-DTPA MRI. Figure (b) shows no washout and no capsule in PVP of Gd-EOB-DTPA MRI. Tumor diameter > 2cm, and LR-4. Figure (c) shows washout in delayed phase of CT. Adding CT delayed phase images to Gd-EOB-DTPA MRI, the lesion was classified as LR-5.
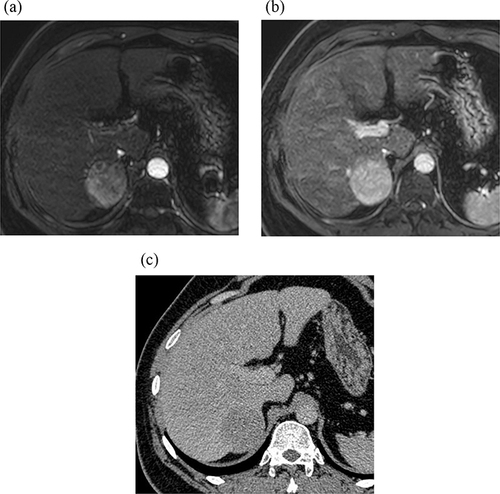
Figure 3 52-year-old man with cirrhosis and HCC. Figure (a) shows APHE of Gd-EOB-DTPA MRI. Figure (b) shows no washout and no capsule in PVP of Gd-EOB-DTPA MRI. Tumor diameter > 2cm, and LR-4. Figure (c) shows washout and enhancing capsule in delayed phase of CT. Adding CT delayed-phase images to Gd-EOB-DTPA MRI, the lesion was classified as LR-5.
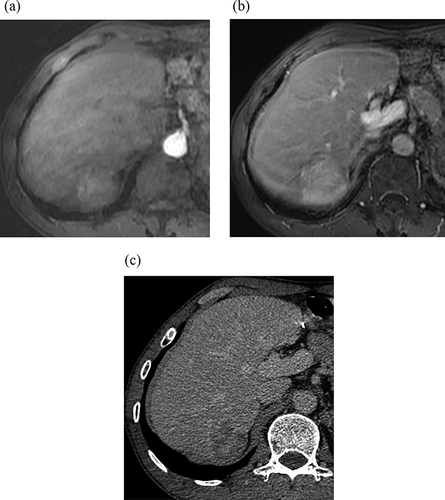
Table 3 Logistic Regression Analysis for the Diagnosis of HCC
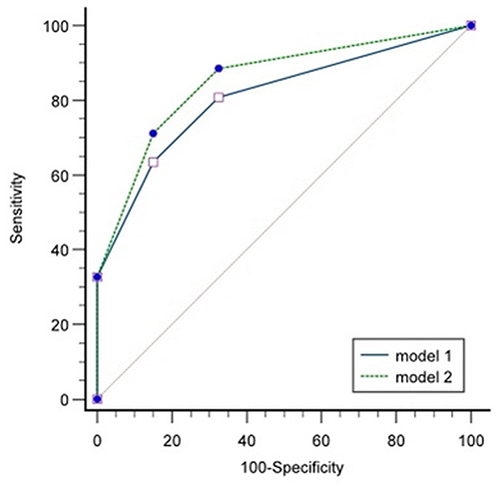
Figure 4 The blue solid line was the ROC of model 1. The green dotted line is the ROC of model 2.
Data Sharing Statement
The data that support the findings of this study are available from the corresponding author upon reasonable request.