
Figures & data
Figure 1 A flow chart.
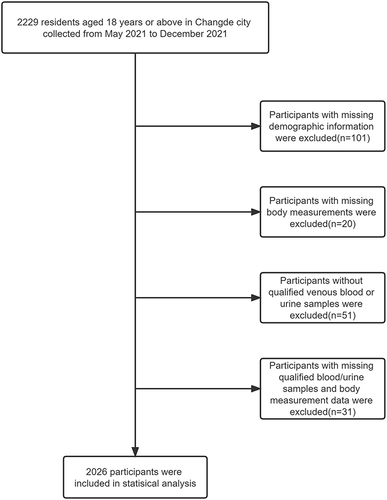
Table 1 Participant Characteristics
Table 2 Univariate and Multivariate Analysis of Factors Associated with UACR
Table 3 Multivariate Logistic Analysis for the Association Between CVAI and Albuminuria
Table 4 Multinomial Logistic Regression Model of Factors Influencing the Degree of Albuminuria (Normal Albuminuria, Microalbuminuria and Macroalbuminuria)
Table 5 Threshold Effect of the Association Between CVAI and Albuminuria in Han and Tujia Ethnicity
Figure 2 The relationship between CVAI and albuminuria. The midline represents a smooth curve fit between variables. The curves on either side represent the 95% confidence interval for the fit. The model was adjusted for SBP, DBP, FPG, PPG, HbA1c, TC, LDL-C, UA, BUN, ALT, AST, eGFR, preexisting hypertension and preexisting DM.
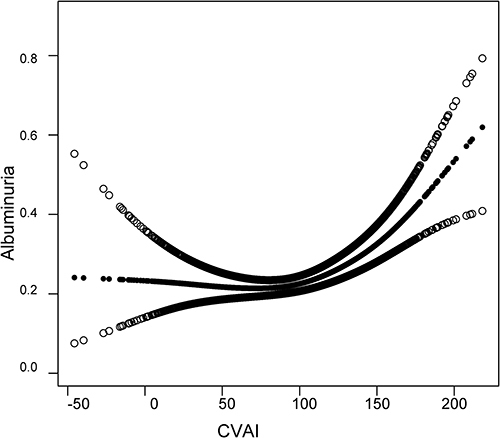
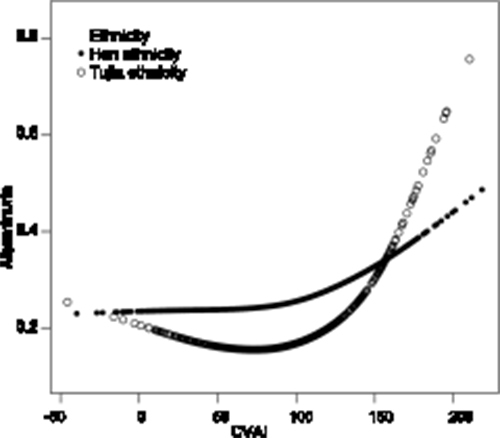
Figure 3 The relationship between CVAI and albuminuria in Han and Tujia ethnicity. The model was adjusted for SBP, DBP, FPG, PPG, HbA1c, TC, LDL-C, UA, BUN, ALT, AST, eGFR, preexisting hypertension and preexisting DM.
Data Sharing Statement
The datasets used and analyzed during the current study are available from the corresponding author on reasonable request.