326
Views
3
CrossRef citations to date
0
Altmetric
ORIGINAL RESEARCH

Correlation Analysis and Diagnostic Value of Serum Homocysteine, Cystatin C and Uric Acid Levels with the Severity of Coronary Artery Stenosis in Patients with Coronary Heart Disease

ORCID Icon, ORCID Icon, ORCID Icon, ORCID Icon, ORCID Icon, ORCID Icon & ORCID Icon show all
Pages 2719-2731 | Received 07 Mar 2023, Accepted 22 Jun 2023, Published online: 29 Jun 2023

Figures & data

Table 1 Comparison of the Clinical Data of Patients in Two Groups

Table 2 The Serum Levels and Clinical Diagnostic Value of Cys C, Hcy and UA

Table 3 The Relationship Between Gensini Score and Variables

Figure 1 The ROC curve of Hcy, Cys C and UA for diagnostic value of CHD. The ROC curve analysis of Hcy, Cys C and UA showed that the AUC were 0.761 (95% CI, 0.697–0.816), 0.612 (95% CI, 0.543–0.678) and 0.639 (95% CI, 0.570–0.704) for CHD, respectively. For Hcy, Cys C and UA, respectively, the optimal cut-off value, the sensitivity and specificity in diagnosing CHD were shown in (a-c). In addition, the AUC of Hcy was the highest (0.761) among the three, and there was notably significant difference when compared with the other two (p = 0.0003 and 0.0193), shown in (d). While the Youden index showing the authenticity of the test was 0.3804, 0.2423 and 0.2290, respectively.

Abbreviations: AUC, area under the curve; CHD, coronary heart disease; CI, confidence interval; Cys C, cystatin C; Hcy, homocysteine; ROC, receiver-operating characteristic; UA, uric acid.
Figure 1 The ROC curve of Hcy, Cys C and UA for diagnostic value of CHD. The ROC curve analysis of Hcy, Cys C and UA showed that the AUC were 0.761 (95% CI, 0.697–0.816), 0.612 (95% CI, 0.543–0.678) and 0.639 (95% CI, 0.570–0.704) for CHD, respectively. For Hcy, Cys C and UA, respectively, the optimal cut-off value, the sensitivity and specificity in diagnosing CHD were shown in (a-c). In addition, the AUC of Hcy was the highest (0.761) among the three, and there was notably significant difference when compared with the other two (p = 0.0003 and 0.0193), shown in (d). While the Youden index showing the authenticity of the test was 0.3804, 0.2423 and 0.2290, respectively.

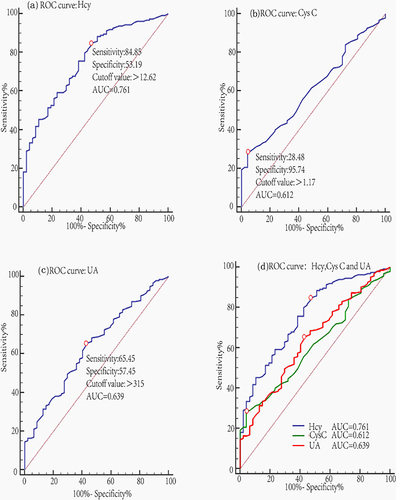
Table 4 The Clinical Diagnostic Value of Combined Detection of Hcy, Cys C and UA

Figure 2 The ROC curve of combined detection of Hcy, Cys C and UA for diagnosing CHD. The ROC curve analysis of combined Hcy with Cys C, combined Hcy with UA, combined Cys C with UA and combined Hcy and Cys C with UA were drawn in (a-d), showing that AUC were 0.762 (95% CI, 0.698–0.817), 0.769 (95% CI, 0.706–0.824), 0.657 (95% CI, 0.588–0.720) and 0.768 (95% CI, 0.706–0.823) for CHD. The AUC of combined Hcy with Cys C, combined Hcy with UA and combined Hcy and Cys C with UA having no statistically significant difference (p > 0.05), was higher as compared with combined Cys C with UA, and the difference was statistically significant (p = 0.014, 0.0024 and 0.0027). The Youden index presented that the authenticity of combined Cys C with UA was 0.2753. While the combined Hcy and Cys C with UA had the lowest sensitivity (p<0.001) but the highest specificity (p < 0.05).

Abbreviations: AUC, area under the curve; CHD, coronary heart disease; CI, confidence interval; Cys C, cystatin C; Hcy, homocysteine; ROC, receiver-operating characteristic; UA, uric acid.
Figure 2 The ROC curve of combined detection of Hcy, Cys C and UA for diagnosing CHD. The ROC curve analysis of combined Hcy with Cys C, combined Hcy with UA, combined Cys C with UA and combined Hcy and Cys C with UA were drawn in (a-d), showing that AUC were 0.762 (95% CI, 0.698–0.817), 0.769 (95% CI, 0.706–0.824), 0.657 (95% CI, 0.588–0.720) and 0.768 (95% CI, 0.706–0.823) for CHD. The AUC of combined Hcy with Cys C, combined Hcy with UA and combined Hcy and Cys C with UA having no statistically significant difference (p > 0.05), was higher as compared with combined Cys C with UA, and the difference was statistically significant (p = 0.014, 0.0024 and 0.0027). The Youden index presented that the authenticity of combined Cys C with UA was 0.2753. While the combined Hcy and Cys C with UA had the lowest sensitivity (p<0.001) but the highest specificity (p < 0.05).

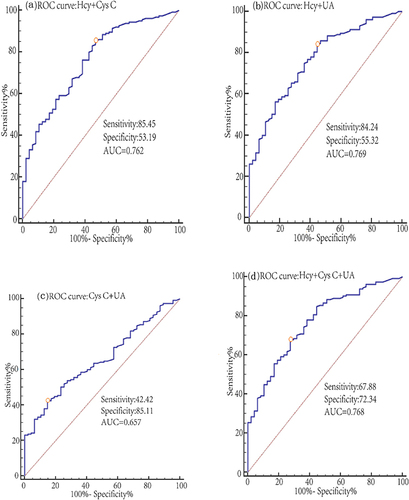
Table 5 The Comparison of the AUC Among the Hcy, Combined Hcy with Cys C, Combined Hcy with UA and Combined Hcy and Cys C with UA