
Figures & data
Figure 1 The number of patients treated monthly for all types of pneumonia in South Korea.
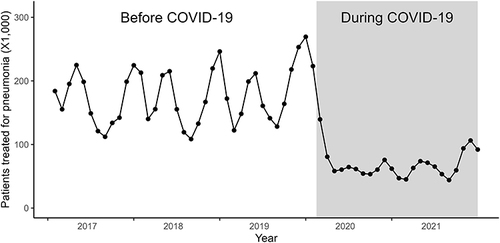
Table 1 Baseline Characteristics Before and During the COVID-19 Pandemic
Figure 2 Flowchart of the study. ARISCAT: Assess Respiratory Risk in Surgical Patients in Catalonia.
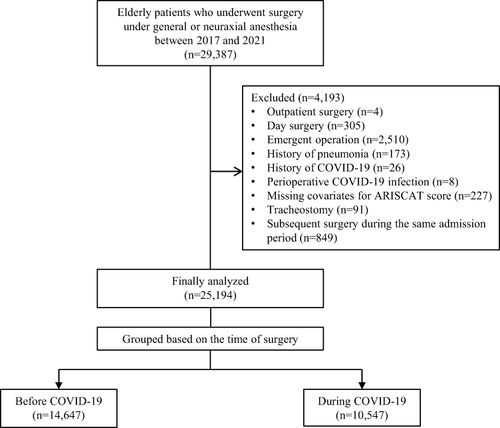
Figure 3 The number of monthly postoperative pneumonia cases per 1000 patients. The blue solid line represents the expected number of pneumonia and the red dashed line indicates the de-seasonalized expected number of pneumonia cases in model 0.
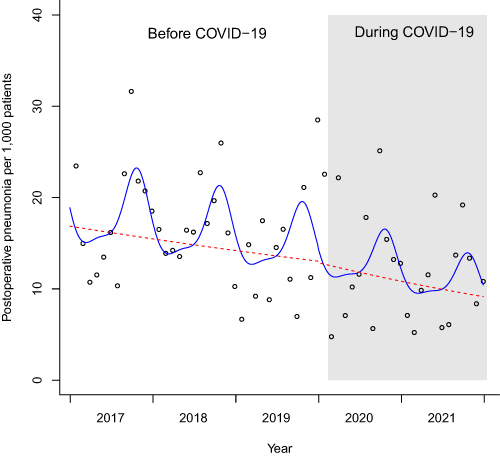
Table 2 Interrupted Time Series Analysis for the Monthly Incidence Rate of Postoperative Pneumonia