Figures & data
Figure 1 Flow chart for characterization of lactate metabolism-related lncRNAs.
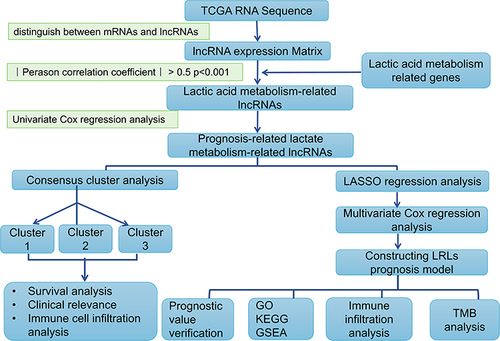
Figure 2 Screening of lactate metabolism-related lncRNAs (LRLs) with prognostic value. (A) Pearson correlation analysis established a co-expression network of lactate metabolism-associated genes (LRG) and lncRNAs. (B) Forest plot of 20 lncRNAs identified as prognostic lactate metabolism-associated lncRNAs in univariate Cox regression analysis. (C) Heat map of the expression of prognosis-related lactate metabolism-related lncRNAs in CC and normal tissues. (D) Box plots of 20 differentially expressed lncRNAs related to lactate metabolism between CC and normal tissues. Normal tissues are shown in blue and tumor tissues are shown in red. (*p < 0.05, **p < 0.01).
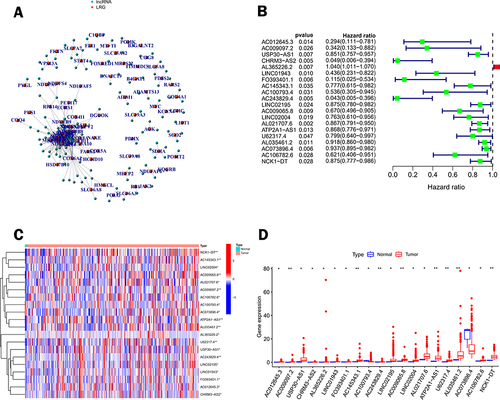
Figure 3 Classification of CC by consensus clustering. (A) The cumulative distribution function (CDF) plot shows the cumulative distribution function of the consistency matrix for k values (indicated by different colors) between 2 and 9. (B and C) Relative change in area under the CDF curve (B) and trace plot (C) depending on the different k values. (D) The clustering is most stable when k=3. (E) Survival analysis of the three clusters. (F) Heat map and difference analysis of clinicopathological characteristics among the three clusters (including age, T, M, N status, and grading). (G–J) Shows the differences in the content of T cells follicular helper (G), T cells CD8 (H), T cells CD4 memory resting (I), and B cells memory (J) in the three clusters.
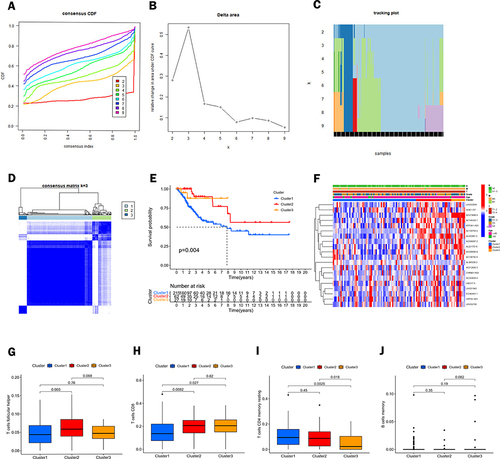
Figure 4 Construction and assessment of risk models for lactate metabolism-associated lncRNAs. (A) A risk score of the prognostic model for the whole cohort of TCGA CC. (B) Scatter plot of survival of CC patients. (C) Heat map showing the expression levels of lactate metabolism-associated lncRNAs in the high-risk and low-risk groups. (D) Kaplan-Meier survival analysis between the high-risk and low-risk groups. (E) Heat map between the risk score and clinicopathological features of the risk model based on the ten lncRNAs related to lactate metabolism. (F) Comparison between risk model and clinicopathological characteristics by 1-year area under the ROC curve (AUC) values. (G) AUC values for overall survival prediction at 1, 3, and 5 years for the entire dataset.(*p < 0.05, ***p < 0.001).
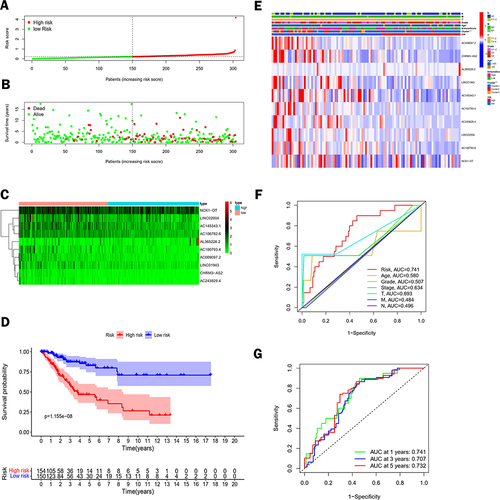
Figure 5 Independent prognostic value of the risk model and construction and evaluation of the nomogram. (A and B) Forest plots based on univariate (A) and multivariate (B) Cox regression analyses were performed in the entire cohort of TCGA CC. (C) Nomogram to estimate 1 -, 3 -, and 5-year survival rates. (D) Calibration curve of the nomogram.
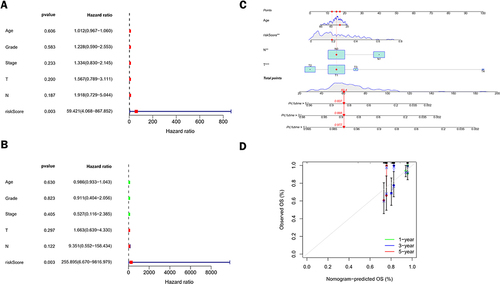
Figure 6 Association between risk characteristics and clinicopathological parameters. (A) Age, (B) Risk scores of patients in categories 1, 2, and 3, and (C) T-stage of these patients with different clinicopathological stratification. (D–L) Kaplan-Meier survival curves for low and high-risk groups of CC patients with (D) Age > 65 years, (E) Age <= 65 years, (F) G1-2, (G) G3, (H) M0, (I) M1, (J) N0, (K) N1-3 and (L) T1-2.
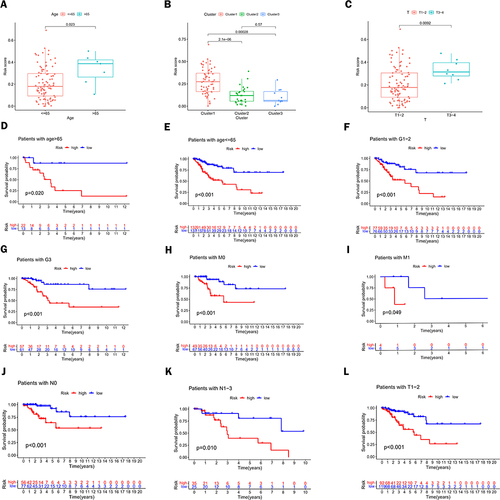
Figure 7 Biological function and pathway analysis of lactate metabolism-related lncRNAs. (A and B) Enrichment analysis of GSEA pathways in high-risk (A) and low-risk (B) groups. (C and D) Bar and bubble plots of Gene Ontology (GO). (E and F) Bar and bubble plots of the Kyoto Encyclopedia of Genes and Genomes (KEEG) pathway.
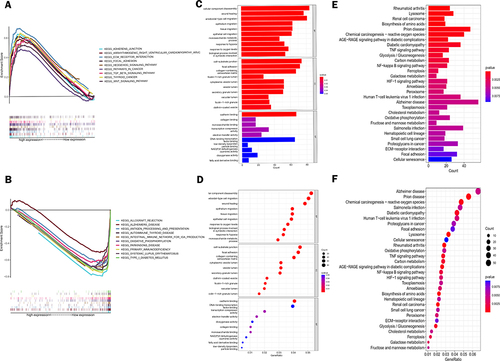
Figure 8 Analysis of tumor mutations between different risk groups. Waterfall plots of the top 20 most commonly mutated genes in the high-risk group (A) and low-risk group (B). (C) Survival analysis of CC patients between the high TMB group and low TMB group. (D) Survival analysis of patients with TMB combined with a risk score.
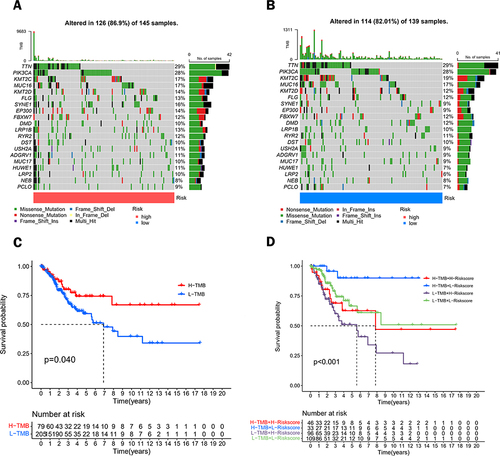
Figure 9 Analysis of differential immune infiltration in the low- and high-risk groups. (A) Analysis of the content of 22 immune cells in the high-risk and low-risk groups. (B) Analysis of the differences in stromal scores, immune scores, and estimated scores between the high- and low-risk groups. (C) Box plots showing the differentiation of the two risk groups for immune-related signal enrichment. (D) Heat map depicting the distribution of immune cells between the low- and high-risk groups using ssGSEA. (E and F) Response to anti-CTLA-4 and anti-PD-1 treatment in different risk score groups.(*p < 0.05, **p < 0.01, ***p < 0.001).
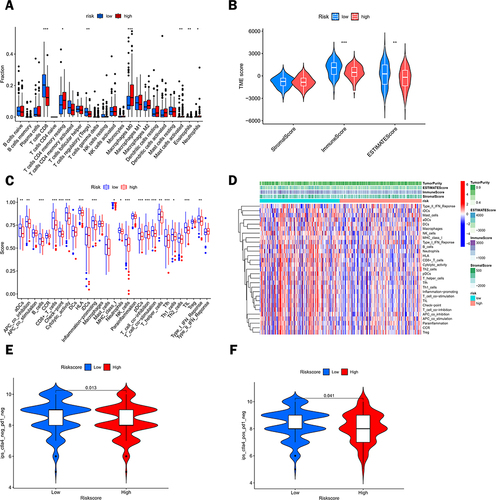
Figure 10 Correlation analysis of different immune cells and risk scores. Pearson correlation analysis between (A) Eosinophils, (B) Macrophages M0, (C) Macrophages M2, (D) Mast cells activated, (E) Mast cells resting, (F) Neutrophils, (G) T cells CD4 memory resting, (H) T cells CD8 and (I) T cells regulatory (Tregs).
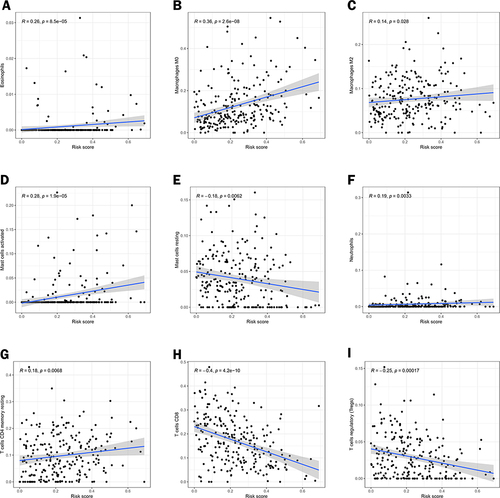
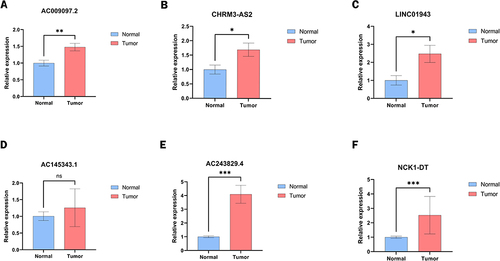
Figure 11 To verify the expression levels of lncRNAs related to lactate metabolism in tumor tissues and adjacent tissues. (A–F) performed the expression of six candidate lncRNAs between cervical tumor tissues and paracancerous tissues.(nsp>0.05,*p < 0.05, **p < 0.01, ***p < 0.001).