Figures & data
Figure 1 Flow diagram of patients enrolled.
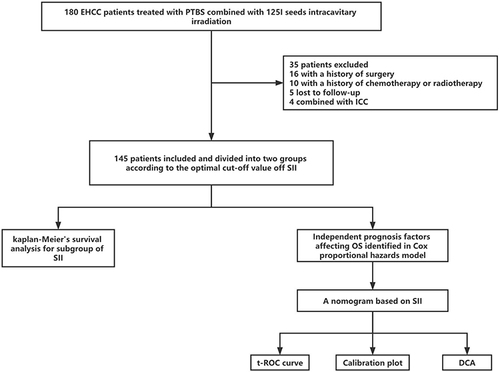
Table 1 Baseline Clinical Characteristics of the Participants
Table 2 Correlation Between SII and Clinical Variables in EHCC Patients
Figure 2 Continued.
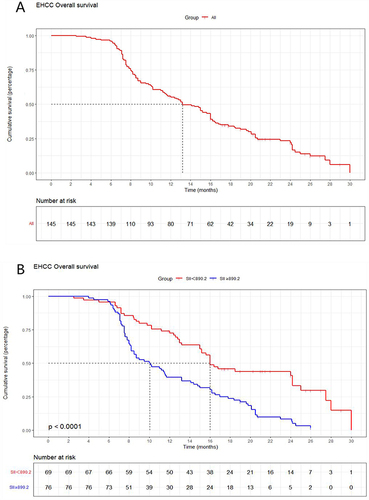
Figure 2 Kaplan–Meier curves indicating OS of EHCC patients after PTBS combined with 125I seed implantation. The whole cohort (A); stratified by the value of SII in the whole cohort (B), stratified according to the SII level in the hCCA subgroup (C), and stratified according to the SII level in the dCCA subgroup (D).
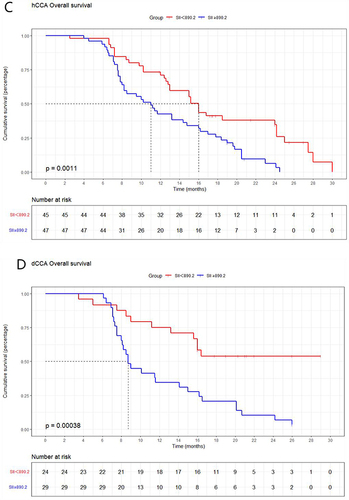
Table 3 Univariate Analyses of Features Correlated with OS of EHCC Patients
Figure 3 Forest plot based on the results of multivariate analysis of the indicators associated with OS.
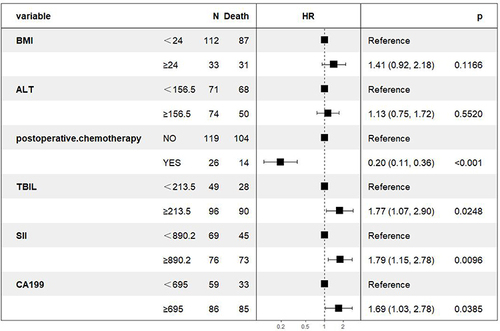
Figure 4 Survival nomogram based on SII.The total points of every patient can be used to predict the OS of EHCC patients.
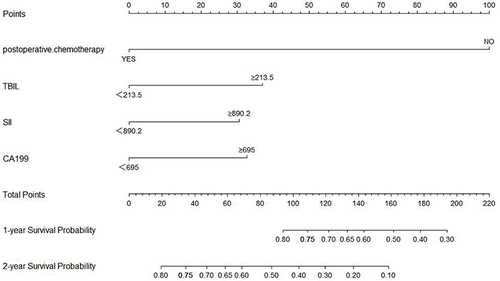
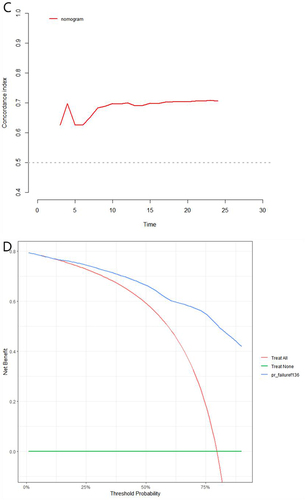
Figure 5 Continued.
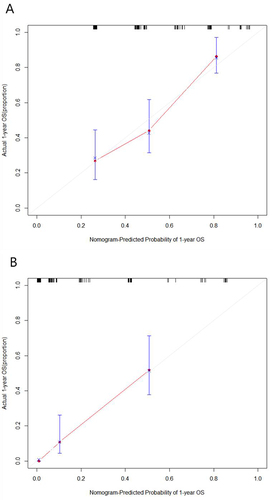
Figure 5 Calibration curves for 1-year (A), 2-year (B) OS for the nomogram with internal validation. (C) Time-dependent ROC of the nomogram for predicting OS. (D) Decision curve analysis of the nomogram.