
Figures & data
Table 1 Baseline Characteristics of Patients with Intracerebral Hemorrhage with and without New-Onset PAF
Figure 1 Study flow chart.
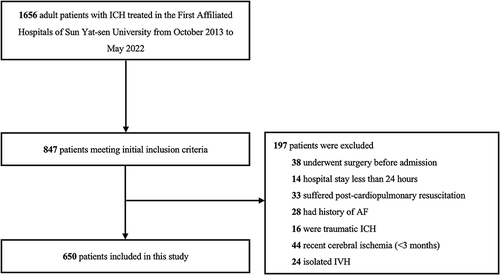
Table 2 Univariable Regression Model of Risk Factors for New-Onset PAF in Patients with Intracerebral Hemorrhage
Table 3 Multivariate Logistic Regression Analyses of Risk Factors for New-Onset PAF Among Patients with Intracerebral Hemorrhage
Table 4 Sensitivity Analysis: Multivariable Analyses of Risk Factors for New-Onset PAF Restricted to Patients with Baseline NT-proBNP Levels (n = 428)
Table 5 Characteristics of Patients with Intracerebral Hemorrhage Stratified by Functional Outcomes at Discharge
Table 6 Univariable and Multivariable Regression Model of Predictors of Poor Functional Outcome at Discharge in Patients with Intracerebral Hemorrhage