
Figures & data
Figure 1 Case collection flow chart.
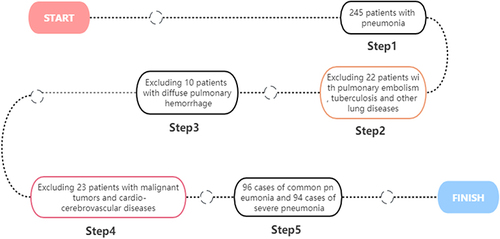
Table 1 Primer Sequence
Table 2 Comparison of Serum miR-24 and miR-223 Levels in the Three Groups ()
Table 3 Comparison of Serum miR-24 and miR-223 Levels and APACHEII Scores Between Survival Group and Death Group at Different Time Points ()
Table 4 Univariate Analysis of Prognosis in Severe Pneumonia Patients [() /n (%)]
Table 5 Correlation Between Serum miR-24 and miR-223 Levels and APACHEII Score, Mechanical Ventilation in Severe Pneumonia Death Cases
Table 6 Predictive Value of Serum miR-24 and miR-223 Levels and APACHEII Scores for the Prognosis of Severe Pneumonia Patients
Figure 2 ROC curve of prognosis of severe pneumonia patients predicted by serum miR-24, miR-223 levels and APACHEII scores.
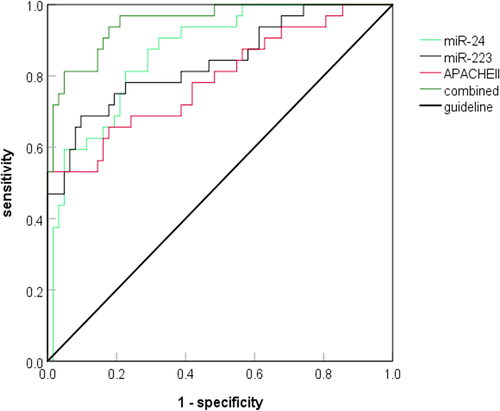
Table 7 Multivariate Logistic Regression Analysis on Factors Affecting Prognosis of Severe Pneumonia Patients