Figures & data
Figure 1 STK3 expression in human normal tissue and oral squamous cell carcinoma tissue. (A) STK3 is expressed in UCEC, PCPG, TGCT, COAD and KIRC in the GEPIA database. (B) STK3 is expressed in CHOL, PAAD, STAD, THYM and GBM in the GEPIA database. (C) STK3 is expressed in HNSC in the GEPIA database. (D) Kaplan–Meier survival analysis revealed that overall survival is poorer in HNSC patients with a high expression of STK3 in the GEPIA datasets. (E) The mRNA expression level of STK3 in adjacent normal tissue and oral squamous cell carcinoma tissues was determined by RT-qPCR. (F) Western blotting analysis of STK3 expression levels in adjacent normal tissues and oral squamous cell carcinoma tissues from patients. (G) Quantification of related STK3 proteins expression in normal and oral squamous cell carcinoma tissues. Statistical significance relative to N or control group, *P < 0.05, **P < 0.01, ***P < 0.001.
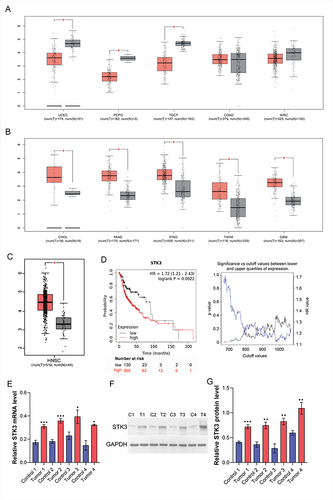
Figure 2 STK3 promotes cell growth by inducing cell cycle arrest. (A and B) IF staining and RT-PCR analyses of STK3 expression in siRNA, overexpression vector treatment-HSC-3 cells. (C and D) IF staining and RT-PCR analyses of STK3 expression in siRNA, overexpression vector treatment-MOC1 cells. (E) Cell proliferation rate as measured by CCK8 in siRNA, overexpression vector treatment-HSC-3 cells. (F) Cell proliferation rate as measured by CCK8 in siRNA, overexpression vector treatment-MOC1 cells. Statistical significance relative to NC group, **P < 0.01, ***P < 0.001.
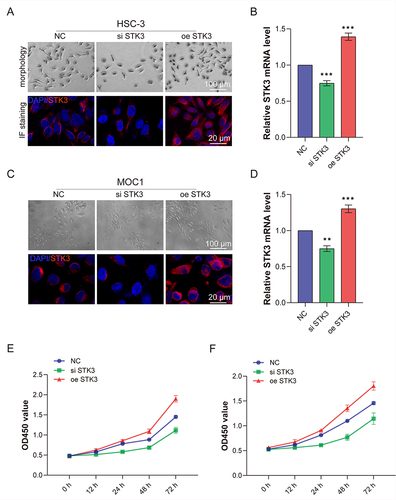
Figure 3 STK3 promotes OSCC cells migration and invasion. (A) STK3 promoted HSC-3 cells migration and invasion; Transwell assays showed in upper line and cell invasion assays showed in down line (bar = 100 μm). (B) Quantifications of transwell and invasion assays. (C) STK3 promoted MOC1 cells migration and invasion; Transwell assays showed in upper line and cell invasion assays showed in down line (bar = 100 μm). (D) Quantifications of transwell and invasion assays. Statistical significance relative to NC group, *P < 0.05, **P < 0.01, ***P < 0.001.
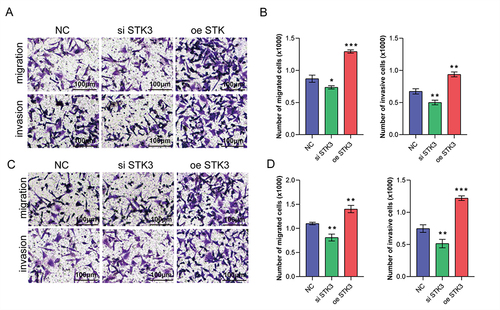
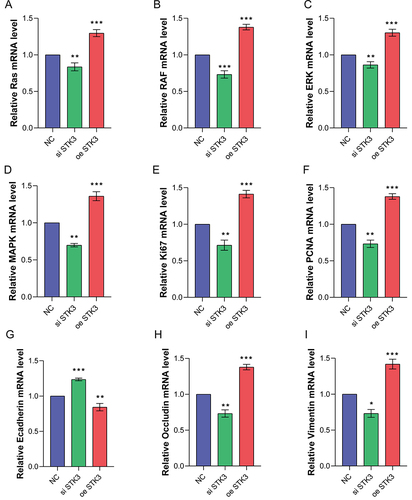
Figure 4 STK3 promoted cells proliferation and invasion by inducing RAS/MAPK signal pathway. (A–D) relative expression of RAS, RAF, ERK and MAPK mRNA after STK3 overexpression or knockdown. (E and F) Relative expression of Ki67 and PCNA mRNA by RT-PCR. (G–I) Relative expression of E cadherin, Occludin and Vimentin mRNA by RT-PCR. Statistical significance relative to NC group, *P < 0.05, **P < 0.01, ***P < 0.001.