Figures & data
Table 1 The Sequence of PCR Primers
Figure 1 Study workflow.
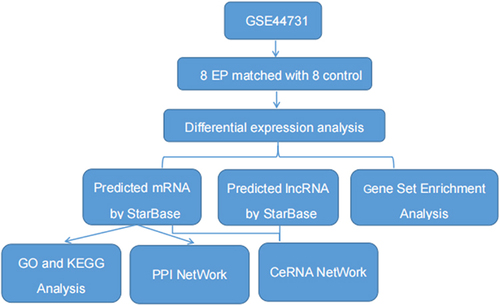
Figure 2 Differentially expressed miRNAs. (A) Volcano map showing the miRNAs molecules obtained from the differential analysis of the GSE44731 dataset, red represents upregulated genes and blue represents downregulated genes. (B) Heat map showing the miRNA molecules obtained from the differential analysis of the GSE44731 dataset.
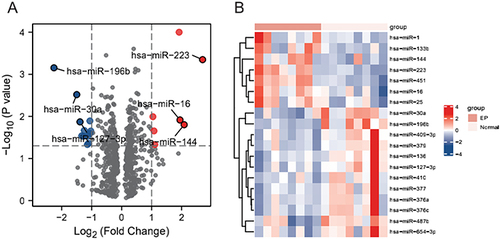
Figure 3 ROC for Differentially expressed miRNA molecules. (A) miRNA-410/miRNA-1/miRNA-133b/miRNA-487b; (B) miRNA-379/miRNA-144/miRNA-16/miRNA-25/miRNA-409-3p; (C) miRNA-376a/miRNA-645-3p/miRNA-376c/miRNA-136/miRNA-377/miRNA-127-3p; (D) miRNA-30a/miRNA-196b/MiR-223/.
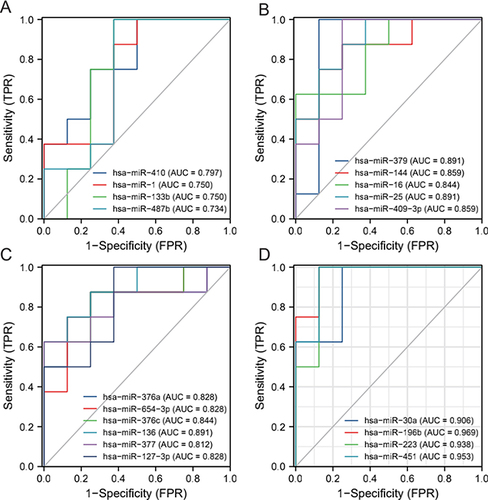
Table 2 BP (Biological Process) of GSE44731 Dataset
Table 3 CC (Cellular Component) of GSE44731 Dataset
Table 4 MF (Molecular Function) of GSE44731 Dataset
Table 5 KEGG (Kyoto Encyclopedia of Genes and Genomes) of GSE44731 Dataset
Figure 4 GO and KEGG enrichment analysis of DEM target genes. (A) Biological processes enriched (BPs) in the GSE44731 dataset; (B) Cell compositions enriched in GSE44731 dataset (CCs); (C) Molecular functions enriched in the GSE44731 dataset (MFs); (D) Signaling pathways enriched in the GSE44731 dataset (KEGG).
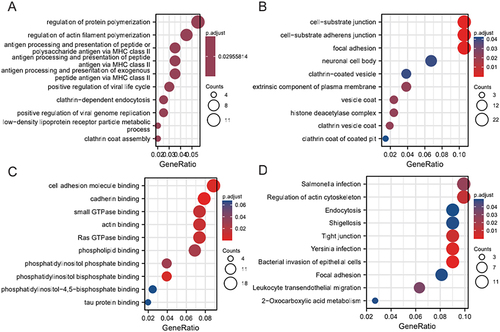
Table 6 GSEA of miRNA
Figure 5 GSEA of miRNAs: (A) Th1 and Th2 cell differentiation; (B) Prion diseases; (C) NF-κB signaling pathway; (D) Chemokine signaling pathway; (E) DNA binding; (F) ATP binding; (G) nucleolus; (H) transcription DNA dependent.
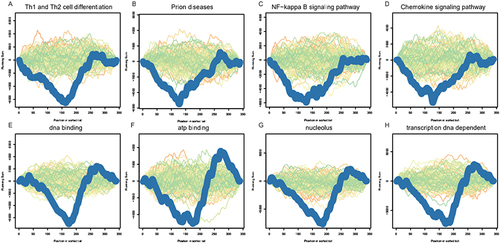
Figure 6 Network construction. (A) PPI network of target genes; (B) miRNA–mRNA interaction network; (C) miRNA–lncRNA interaction network; (D) ceRNA network.
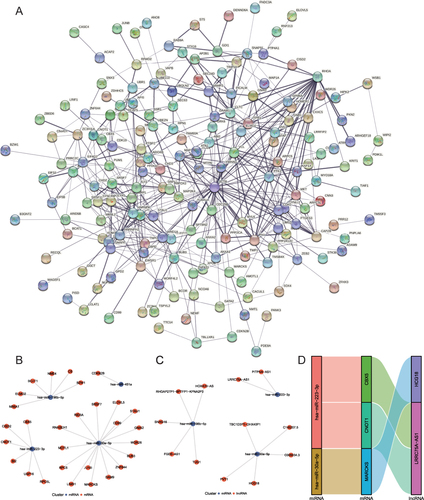
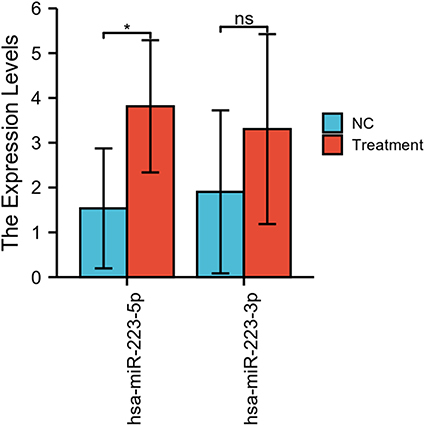
Figure 7 Expression of miRNA-223 in both groups of cells (ns, p≥0.05; *p <0.05).