
Figures & data
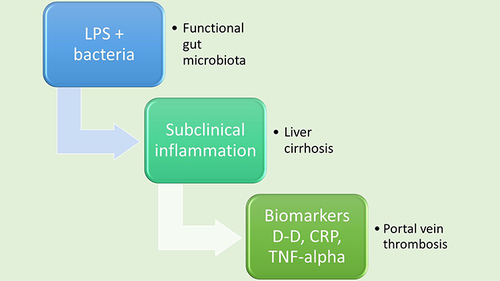
Figure 1 The study participants inclusion flow-chart.
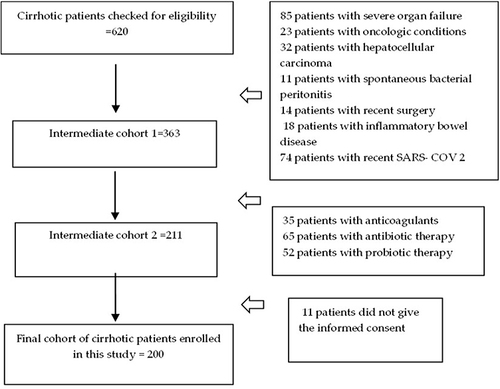
Table 1 Demographic and Biologic Characteristics in Research Participants
Table 2 Clinical Aspects in Research Population
Table 3 Stool’s Microbiota Alterations in Study Group
Table 4 Morphologic Particularities of PVT in Study Group
Figure 2 Distribution of mucosa protective bacteria in patients with LC.
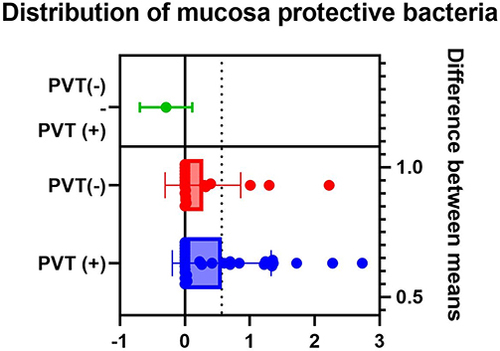
Figure 3 Distribution of neuroactive bacteria in patients with LC.
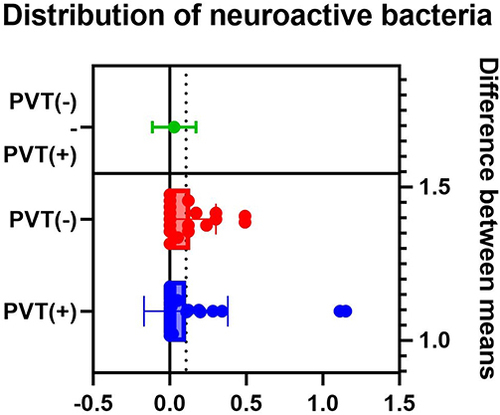
Figure 4 Distribution of mucin degrading bacteria in patients with LC.
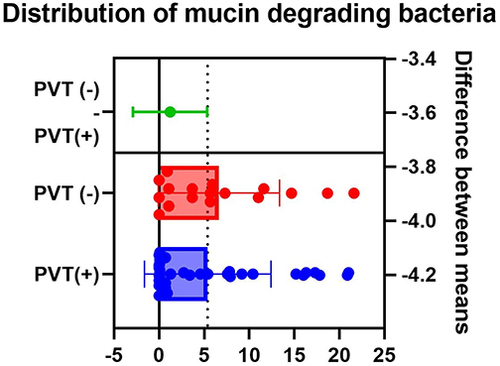
Figure 5 Distribution of LPS (+) bacteria in patients with LC.
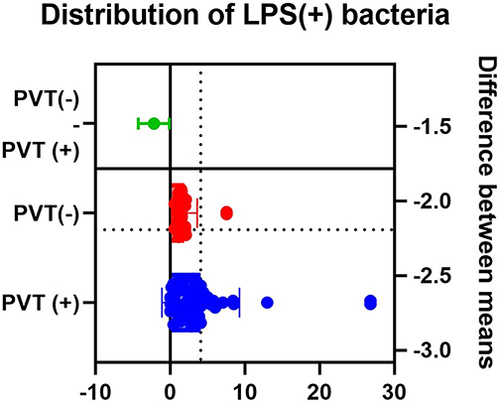
Figure 6 Correlations of PVT severity to biomarkers.
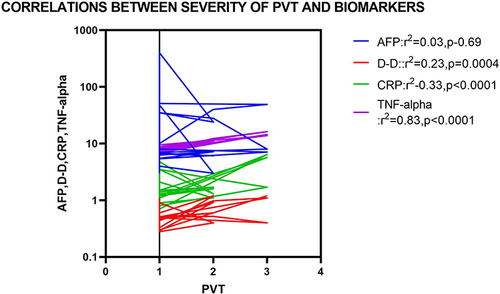
Figure 7 Correlations of PVT severity to various clinical aspects.
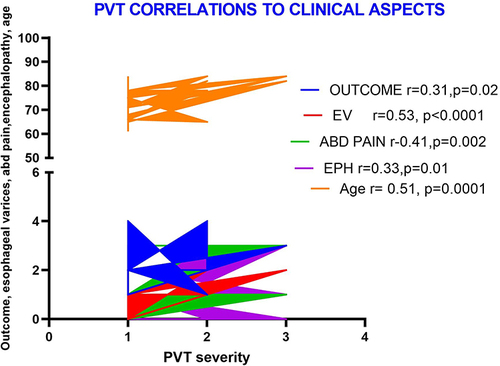
Figure 8 LPS positive bacteria correlations in PVT group.
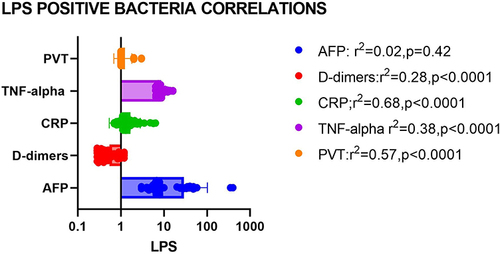
Table 5 The Multivariate Analysis of the Clinical Variables
Table 6 The Multivariate Analysis of the Biological Variables