Figures & data
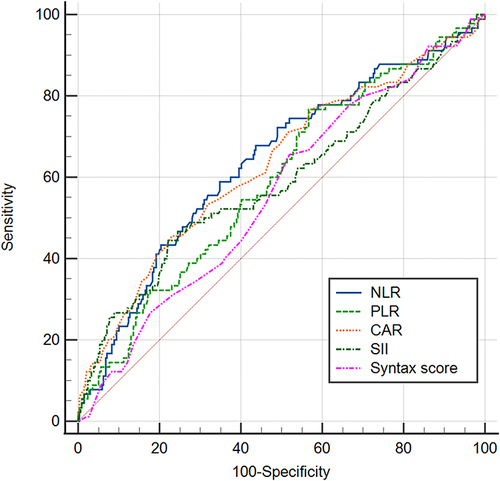
Figure 1 Study flow chart.
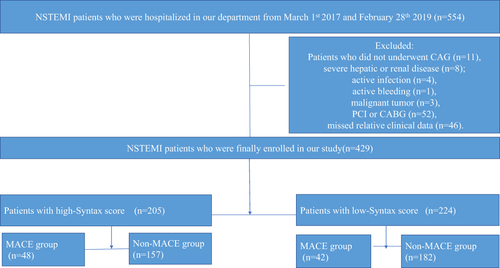
Table 1 Baseline Demographic and Clinical Characteristics Between Patients with High Syntax Score and Patients with Low Syntax Score
Table 2 Angiographic Characteristics Between Patients with High Syntax Score and Patients with Low Syntax Score
Table 3 Laboratory Test Results Between Patients with High Syntax Score and Patients with Low Syntax Score
Table 4 Baseline Demographic and Clinical Characteristics Between Patients with and without MACE
Table 5 Laboratory Test Results Between Patients with and without MACE
Table 6 Correlation Between Syntax Score with Different Systemic Inflammation Indicators
Table 7 Univariable and Multivariable Logistic Regression Results for NLR, PLR, hsCAR, SII in Predicting Coronary Artery Severity
Table 8 Univariable and Multivariable Logistic Regression Results for NLR, PLR, hsCAR, SII and Syntax Score in Predicting MACE
Table 9 Comparison of Area Under Curve Between NLR, PLR, hsCAR, SII and Syntax Score in Predicting MACE in 6-Month Follow-Up
Table 10 Comparison of Area Under Curve Between NLR, PLR, hsCAR, SII and Syntax Score in Predicting Overall Mortality in 6-Month Follow-Up
Figure 2 Comparison of area under curve between NLR, PLR, hsCAR, SII and Syntax score in predicting 6-month MACE.