Figures & data
Figure 1 Gene structure, alteration frequency and conservative analysis of NUSAP1. (A) Chromosome location of NUSAP1 (Highlighted in red line) was shown in first panel. Gene structure of NUSAP1 was shown in second panel. Black box represents exons and grey box represents introns. (B) The bar plot presented the alteration frequency of NUSAP1 in different human tumors. Green, blue, purple, red and grey color represent the rate of mutation, involving deep deletion, fusion, amplification and multiple alterations, respectively. (C) Alignments analysis of NUSAP1 protein sequence among human, cattle, chimpanzee, dog, mouse and pig. The degree of conservation of each amino acid residue among these sequences was marked in blue (100% conserved) green (75% conserved) or khaki (50% conserved).
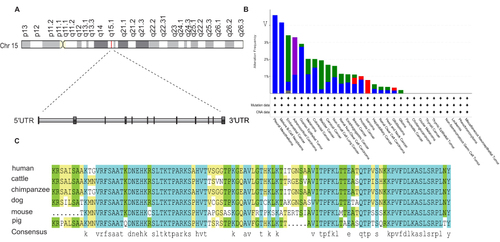
Figure 2 Biological distribution and expression of NUSAP1 in tissues of BALB/c mice and human. (A) Expression and distribution of NUSAP1 proteins in BALB/c mice normal issues detected by IHC (100×; 400×; five samples in each group). (B) Expression and distribution of NUSAP1 proteins in paired human tumors and normal tissues examined by IHC assay (100×; 400×; over three samples in each group).
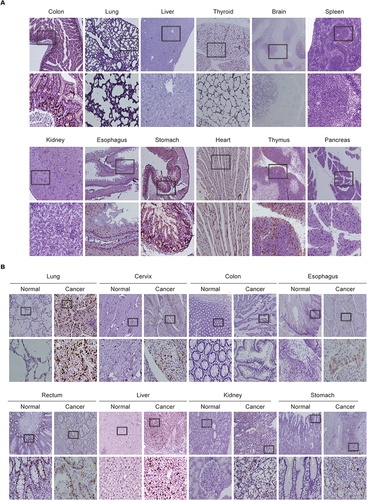
Figure 3 Prognostic value of NUSAP1 in the overall survival of Human Cancers. (A–L) Kaplan-Meier curves of overall survival (OS) according to NUSAP1 expression in various tumors, log rank P<0.05 was considered statistically significant.
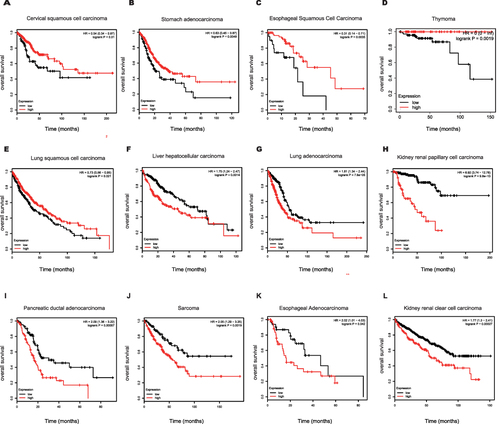
Figure 4 NUSAP1 co-expression patterns in THYM and TGCT are distinct from other tumors. (A) Principal component analysis (PCA) of NUSAP1 co-expression genes in 29 tumor types from TCGA datasets. (B) Principal component analysis (PCA) of NUSAP1 co expression genes in 27 tumor types (THYM and TGCT are excepted) from TCGA datasets. (C) Venn map of the co-expression genes in THYM, LIHC and TGCT. (D–G) Top genes in the most significant module analyzed by MCODE plugin in THYM (D), LIHC (E), TGCT (F) and intersection (G).
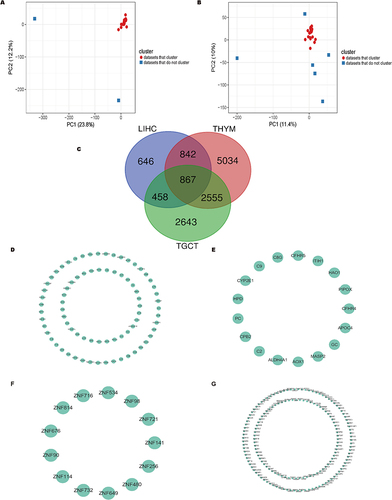
Figure 5 Gene Ontology (GO) and Kyoto Encyclopedia of Genes and Genomes (KEGG) pathway enrichment analysis of co-expressing genes of NUSAP1, consisting with tumor immune infiltration analyses of NUSAP1. (A–D) GO and KEGG pathway enrichment analysis of co-expressing genes of NUSAP1 in THYM (A), TGCT (B), LIHC (C) and in all selected tumors (D). (E) Scatterplots of correlations between NUSAP1 expression and gene markers of B cells, CD8+T cells and CD4+T cells in THYM. (F) NUSAP1 expression has no significant correlation with tumor purity and has significant positive correlations with infiltrating levels of B cell, CD8+T cells, CD4+T cells, macrophages and DC in THYM but negatively correlated with infiltrating levels of neutrophils. (G) NUSAP1 expression is weakly positive related to tumor purity and infiltrating levels of B cell DB+T cells, CD4+T cells, macrophages, neutrophils and DCs in LIHC. (H) NUSAP1 expression has no significant correlations with tumor purity and infiltrating levels of neutrophils and DCs in TGCT.
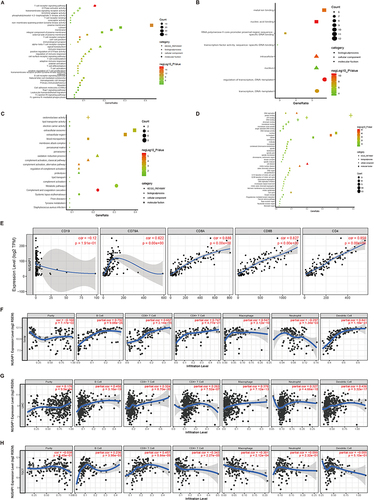
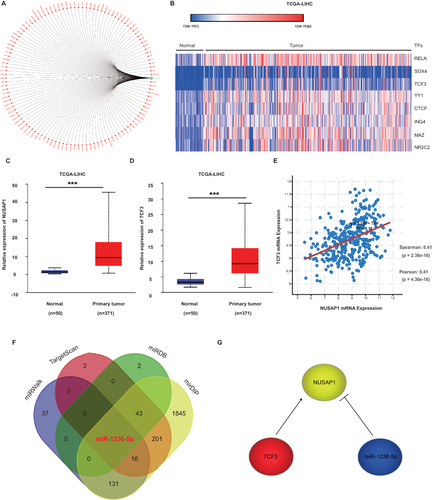
Figure 6 Construction of transcriptional network of NUSAP1 in LIHC. (A) Prediction of transcription factors (TFs) in NUSAP1 promoter from GCBA online database. (B) Differently expressed TFs between normal and tumour tissues in LIHC derived from TCGA database. (C) Expression of NUSAP1 in LIHC derived from TCGA database. (D)Expression of CTCF in LIHC derived from TCGA database. (E) Pearson analysis of the correlation between the expression of NUSAP1 and TCF3 in LIHC derived from TCGA database. (F) Venn map of the predicted overlapping miRNAs involved in the regulation of NUSAP1. (G) A transcriptional network formed by miR-1236-5P, TCF3 and NUSAP1 in LIHC derived from TCGA database. (***p < 0.001).