Figures & data
Figure 1 The flowchart of study population selection.
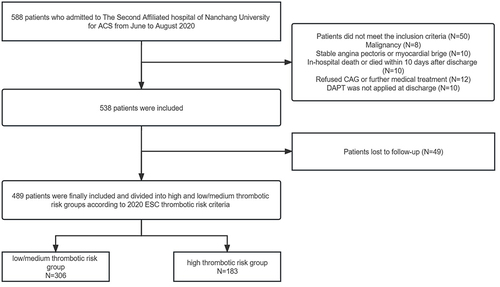
Table 1 Baseline Characteristics of the Two Groups
Table 2 Clinical Outcomes at Follow-Up Time
Figure 2 Landmark analysis of the Kaplan–Meier estimates of MACE within one year and after one year. (A) MACE event rates in the ESC-defined high-risk and ESC-defined low/medium-risk groups and landmark analysis within and after one year. (B) MACE event rates in the DAPT score ≥ 2 and DAPT score < 2 groups and landmark analysis within and after one year.
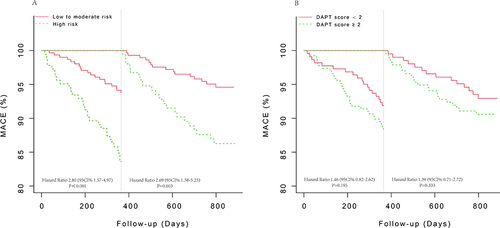
Table 3 Areas Under the Receiver Operating Characteristic Curves for ESC Risk Criteria, DAPT Score, and the Combination of ESC Risk Criteria and DAPT Score in Identifying MACE
Table 4 To Compare the Ability of ESC Risk Criteria, DAPT Score to Predict MACE
Figure 3 The receiver operating characteristic (ROC) curve of the ESC criteria and DAPT score for MACE in patients with ACS.
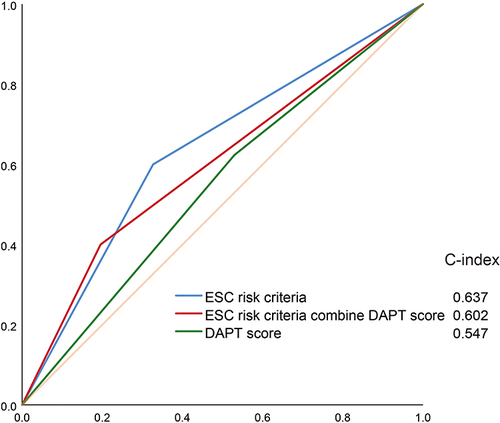
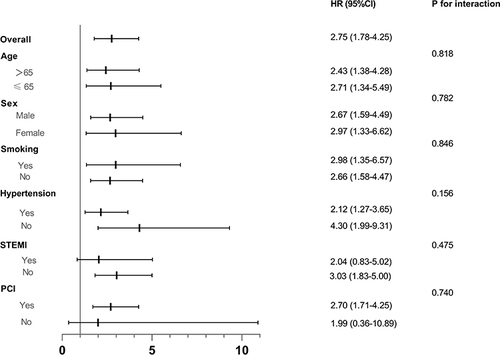
Figure 4 Subgroup analysis of the prognostic value of the ESC criteria in different subgroups for MACE.