
Figures & data
Figure 1 Patient Screening and Grouping Flowchart.
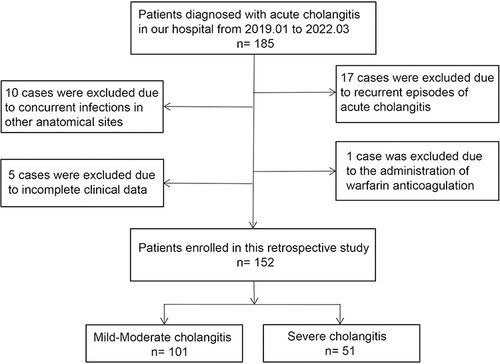
Table 1 Etiological Investigation of Acute Cholangitis
Table 2 30-Day Mortality in Severe Acute Cholangitis versus Mild to Moderate Acute Cholangitis
Table 3 Univariate Analysis of the Risk of Developing Severe Acute Biliary Cholangitis
Figure 2 Spearman Correlation analysis for the independent risk factors; C-reactive protein (CRP), Neutrophil-lymphocyte ratio (NLR), and D dimer (DD) in severe acute cholangitis (n = 152). Line represents best fit of individual points. p value < 0.05, indicating that there are statistically significant but weak correlations between each pair.
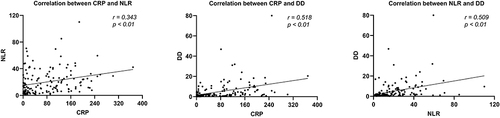
Figure 3 Forest plot based on binary logistic regression. Odds ratios (OR) for blood test results; Neutrophil-lymphocyte ratio (NLR), D-dimer (DD), CRP (10 unit increments) and Transaminase ratio (TR, 0.1 unit increments) in acute severe cholangitis. Thick vertical bars indicate means and 95% confidence interval (CI). These independent risk factors were statistically significant in a multivariate regression analysis.
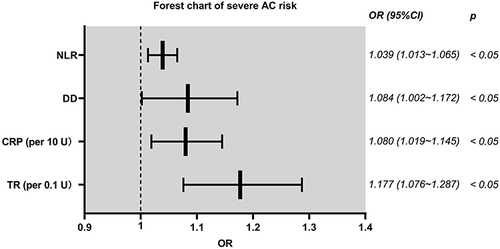
Figure 4 Nomogram model for prediction of acute severe cholangitis with Points score, Total Points score and Diagnostic probability for blood test results; C-reactive protein (CRP), D dimer (DD), Neutrophil-lymphocyte ratio (NLR) and Transaminase ratio (TR). The values of each variable were scored between 0 and 100, then added to give the total points score which was then used to predict the probability of severe acute cholangitis.
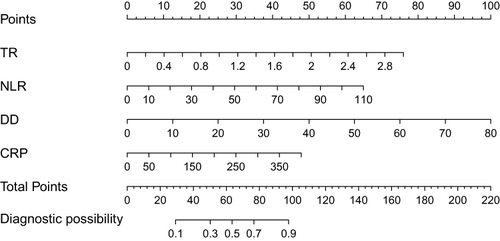
Figure 5 (A) Receiver Operator Characteristics (ROC) curves ie Sensitivity plotted against Specificity for the individual risk factors for acute severe cholangitis; C-reactive protein (CRP), D dimer (DD), Neutrophil-lymphocyte ratio (NLR) and Transaminase ratio (TR) and the Nomogram model. The dashed line represents 50% of Area under the curve (AUC) value. (B) ROC curve for AUC generated by bootstrap resampling (1000 times) as internal validation of the nomogram model. The shaded area represents the 95% confidence intervals of the AUC of the ROC curve.
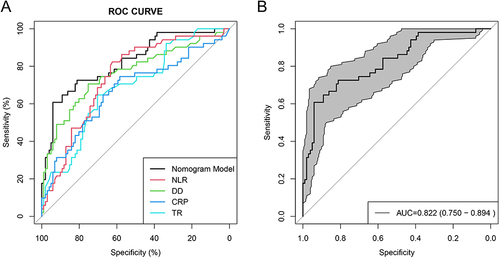
Figure 6 (A) Calibration curve, Predicted versus Observed Probability of acute severe cholangitis, from the Nomogram model. The closer the Decision curve to the Ideal (large hatched) line, the better the performance of the model. The horizontal axis represents the probability of predicting the occurrence of severe acute cholangitis, and the vertical axis represents the probability of actual severe acute cholangitis. (B) This chart displays the observed versus predicted risk results, obtained after 1000 internal validations using the bootstrap sampling method.
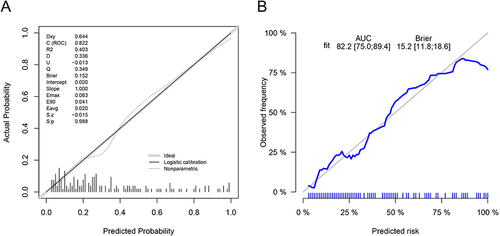
Figure 7 (A) Decision curve analysis for prediction of acute severe cholangitis based on the nomogram model (blue line). Standardized Net Benefit plotted against Net Cost Benefit as the probability threshold was varied. Faint gray (All) line represents patients with acute severe cholangitis who received treatment. Heavier horizontal line (None) indicates no patients with acute severe cholangitis. A high risk threshold is indicative of a high probability of being diagnosed with severe acute cholangitis. (B) This chart is the result after 1000 internal validations using bootstrap sampling method.
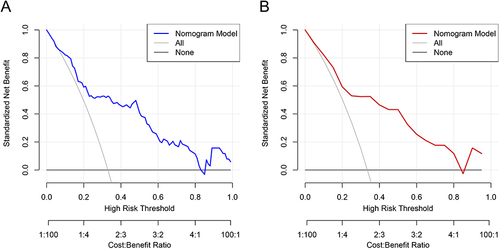
Table 4 The Incidence of Severe Acute Cholangitis in Low-Risk and High-Risk Group