Figures & data
Table 1 Demographic, Electrocardiographic, and Angiographic Features of the Study Population
Table 2 The Relationship Between Electrocardiographic and Angiographic Regions of the Study Population
Figure 1 ECG pattern of patient with large diagonal branch (D1) occlusion. ≥10mm T wave and ST elevation in lead V2; ST elevation lead I and aVL; and ≥2 mm ST depression lead III.
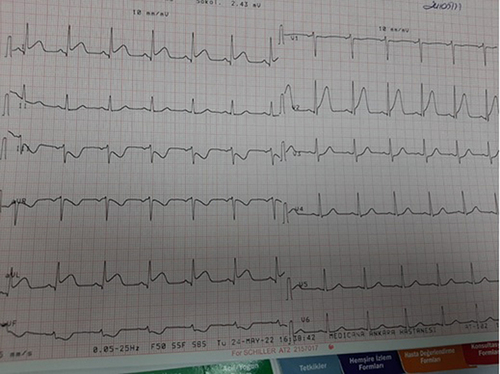
Figure 2 ECG pattern of patient with small diagonal branch (D2) occlusion. Normal T wave and ST elevation in lead V2; minimal ST elevation in lead I and aVL, and <2 mm ST depression lead III.
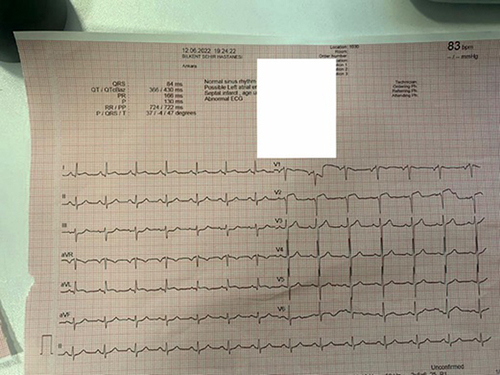
Table 3 Electrocardiographic Algorithm of Lateral Myocardial Infarction as Ilkay Classification
Figure 3 Isolated lateral wall myocardial infarction according to diagonal branches (D1 or D2) and the obtuse marginal has not been clearly identified as electrocardiographic classification. Therefore, there is a need for a new electrocardiogram (ECG) interpretation to accurately predict acute occlusion involving lateral part of ventricle.