164
Views
1
CrossRef citations to date
0
Altmetric
Endocrinology

Comparing Diagnostic Efficacy of C-TIRADS Positive Features on Different Sizes of Thyroid Nodules

ORCID Icon, ORCID Icon, , &
Pages 3483-3490 | Received 28 Apr 2023, Accepted 25 Jul 2023, Published online: 14 Aug 2023

Figures & data

Table 1 Pathological Results of Thyroid Nodules of Each Group

Table 2 C-TIRADS Positive Features in Benign and Malignant Thyroid Nodules of Each Group

Figure 1 Typical ultrasonic imaging of thyroid nodules in each groups and ROC curves of each group. Longitudinal section (A) and transverse section (B) showed a left thyroid nodule ≤10 mm, postoperative pathology showing papillary thyroid microcarcinoma (C). Longitudinal section (D) and transverse section (E) showed a right thyroid nodule >10 mm, <20 mm, postoperative pathology showing papillary thyroid microcarcinoma (F). Longitudinal section (G) and transverse section (H) showed a left thyroid nodule ≥20 mm, postoperative pathology showing follicular adenoma (I). ROC curve of A1 group (J). ROC curve of A2 group (K). ROC curve of A3 group (L).

Figure 1 Typical ultrasonic imaging of thyroid nodules in each groups and ROC curves of each group. Longitudinal section (A) and transverse section (B) showed a left thyroid nodule ≤10 mm, postoperative pathology showing papillary thyroid microcarcinoma (C). Longitudinal section (D) and transverse section (E) showed a right thyroid nodule >10 mm, <20 mm, postoperative pathology showing papillary thyroid microcarcinoma (F). Longitudinal section (G) and transverse section (H) showed a left thyroid nodule ≥20 mm, postoperative pathology showing follicular adenoma (I). ROC curve of A1 group (J). ROC curve of A2 group (K). ROC curve of A3 group (L).

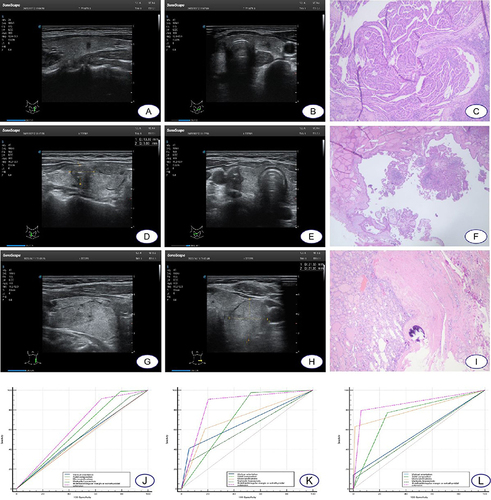
Table 3 The Diagnostic Efficacy of Different Positive Features in Each Groups