
Figures & data
Figure 1 Typical picture of QFR. A representative case with RCA for QFR =0.87.
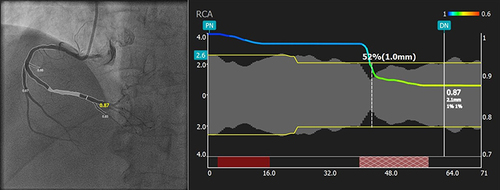
Table 1 Patient Demographics and Clinical Data
Table 2 Primary Angiographic and Interventional Therapy Characteristics
Figure 2 Blood lipid and inflammatory characteristics. (A) Blood lipid and inflammatory changing trends in statin monotherapy group. *P<0.05 vs baseline (B) Blood lipid and inflammatory changing trends in statin plus evolocumab group. *P<0.05 vs baseline (C) Blood lipid and inflammatory measurements between two groups. *P<0.05 vs statin plus evolocumab.
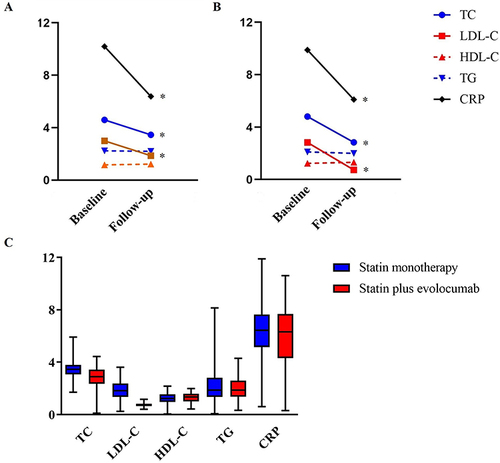
Table 3 Non-Infarct-Related Artery Characteristics
Table 4 Adverse Events in Follow Up
Figure 3 Blood pressure and HbA1c in statin monotherapy and statin plus evolocumab groups. (A) Blood pressure; (B) HbA1c. Error bars are 95% CIs.
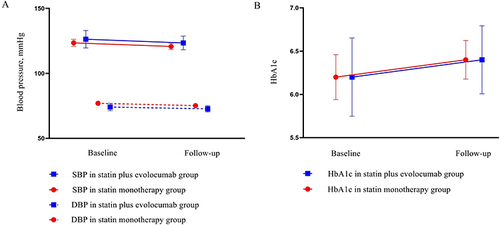
Figure 4 Serious adverse events between two groups in follow-up.
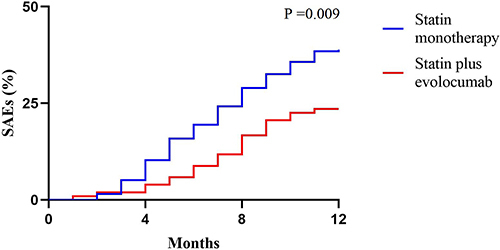
Table 5 Univariate and Multivariate Regression Analysis for Rehospitalization for UA