
Figures & data
Table 1 Clinicopathologic Features of the Cohort
Table 2 The Clinical and Pathological Characteristics of Different Groups
Table 3 Predictors of Recurrence Free, Cancer-Specific and Overall Survival
Figure 1 Kaplan-Meier curves were generated to assess the recurrence-free survival, cancer-specific survival, and overall survival based on the values of NLR, PLR, LMR, and RDW.
Abbreviations: NLR, neutrophil-to-lymphocyte ratio; PLR, platelet-to-lymphocyte ratio; LMR, lymphocyte-to-monocyte ratio; RDW, red blood cell distribution; RFS, recurrence-free survival; CSS, cancer-specific survival; OS, overall survival.
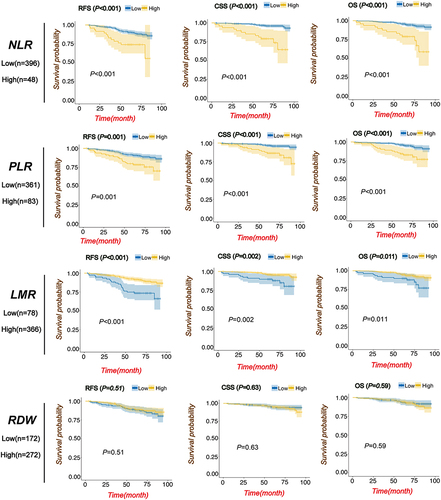
Table 4 Univariate and Multivariate Cox Regression Models Incorporating Prognostic Risk Models and NLR in Prediction of Cancer-Specific Survival, and Overall Survival