
Figures & data
Table 1 Distribution of CHA2DS2-VASc Score and HAS-BLED Score in the NVAF Patients
Table 2 Awareness and Treatment Rates of AF, Antiplatelet and Anticoagulant Use for NVAF Patients Upon Admission
Table 3 Rates of Antiplatelet and Anticoagulant Treatment at Discharge in NVAF Patients and Usage of NOACs
Table 4 Factors Affecting Anticoagulant Therapy at Discharge in NVAF Patients
Table 5 Multivariate Analysis of Predictors of Anticoagulant Therapy in NVAF Patients
Figure 1 Reasons and Frequency for Non-Anticoagulant Therapy in NVAF Patients. The values presented in the figure are expressed as percentages (%).
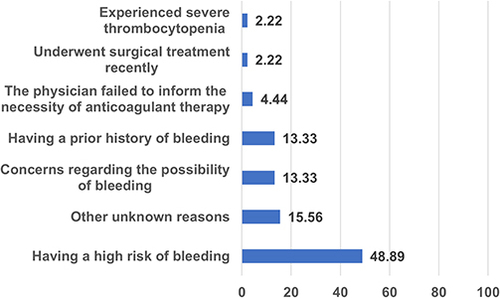
Table 6 Factors Affecting Anticoagulant Therapy in NVAF Patients One Year After Discharge
Table 7 Cox Regression Analysis of Anticoagulant Therapy in NVAF Patients One Year After Discharge
Table 8 Cox Regression Analysis of All-Cause Mortality in NVAF Patients One Year After Discharge