
Figures & data
Figure 1 Schematic illustration of the study design.
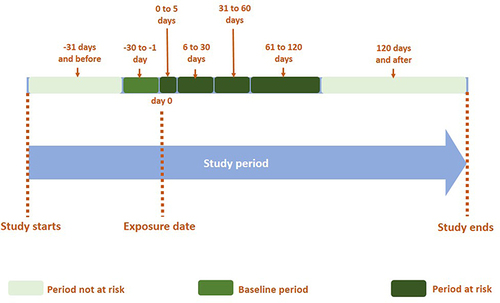
Figure 2 Flow chart for selection of cases for the main analysis.
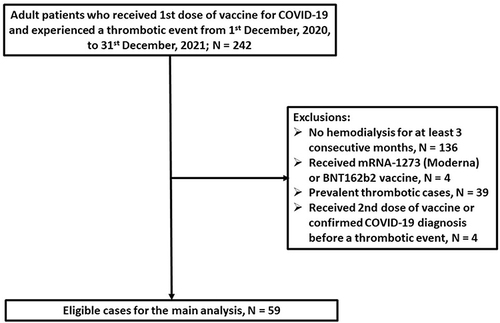
Table 1 Baseline Demographics of Cases Selected for the Self-Controlled Case Series Analysis
Table 2 Incident Rate and IRR of Thrombosis Events in Each Risk Period Compared to Periods Not at Risk for ESRD Patients Receiving Chronic Maintenance Hemodialysis (Total N = 59)
Table 3 Incident Rate and IRR of Bone Fracture Events in Each Risk Period, Compared to Periods Not at Risk for ESRD Patients Receiving Chronic Maintenance Hemodialysis (Total N = 83)
Table 4 Incident Rate and IRR of Thrombosis Events in Each Risk Period, Compared to Periods Not at Risk for the Non-Dialysis Population (Total N = 41)