Figures & data
Table 1 Demographic Characteristics and Clinical Data of SCA Paediatrics
Table 2 Frequency Distribution of Abdominal Ultrasound Findings and Complication of SCA
Table 3 Correlation Between the Spleen Size and Number of Blood Transfusions
Figure 1 Bar chart shows the relation between the type of crises at presentation for ultrasound and splenic size.
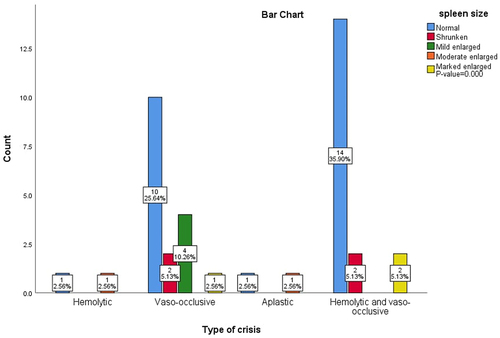
Figure 2 Bar chart shows the relation between the medication used and splenic size.
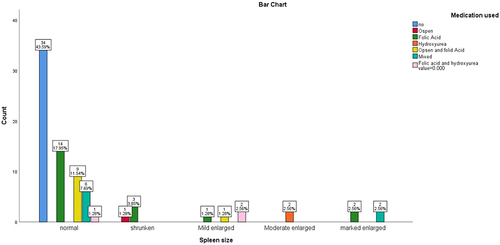
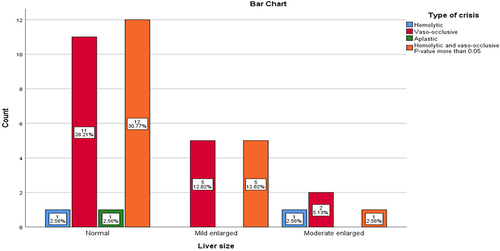
Figure 3 Bar chart shows the correlation between the liver size and type of crises.