
Figures & data
Table 1 Patient Characteristics
Table 2 Selected Radiomics Features and Coefficients
Figure 1 Feature selection and comparison of Radscore. (A) The curve of binomial deviation versus parameter lambda of MRI radiomics model. The vertical axis is the binomial deviation, the horizontal axis represents the log(λ) value, the upper number represents the number of screened features, and the λ at the minimum binomial deviation of the model is the optimal value (vertical dashed line). (B) Graph of the variation of radiomics feature coefficient with λ. (C) Comparison of Radscores between invasive and non-invasive groups.
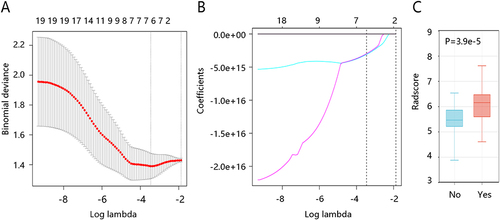
Table 3 Logistic Regression Analyses of Clinical Factors
Figure 2 Construction of the nomogram. (A) Nomogram to predict the risk of prostate cancer invasion. The value of each variable was scored on a scale of 0 to 100, and the scores for each variable were then added together. The sum is located on the total score number line, allowing us to predict the probability of prostate cancer invasion. Gleason classification: 0 for ≤3+4, 1 for ≥4+3. (B) Correlation between total score of the nomogram and risk of prostate cancer invasion. The “total score” is the same as ‘Total points’.
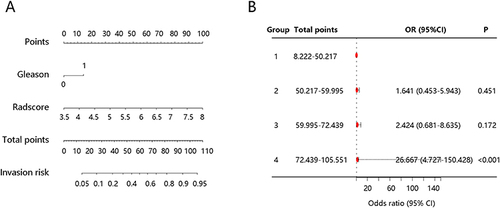
Table 4 The Predictive Values of Three Models for Prostate Cancer Invasion
Table 5 Comparisons of AUC Values Using the Delong Test
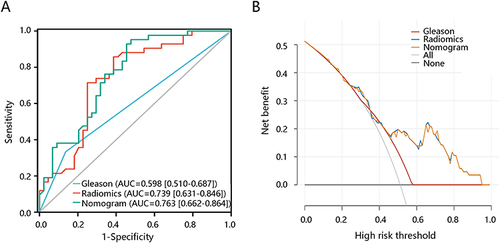
Figure 3 Evaluation of model efficacy. (A) Comparison of receiver operating characteristics curves of different models. (B) Decision curve comparison of different models.
Data Sharing Statement
The datasets generated during and/or analyzed during the current study are available from the corresponding author on reasonable request.