Figures & data
Table 1 Distribution of Demographic, Clinical Characteristics, and Comorbidities of Patients Across the Different Severity Forms Subgroups
Table 2 Comparison of Paraclinical Factors Values Across the Different Severity Forms Subgroups
Table 3 Disease Outcome in the Study Group and Severity Forms Subgroups
Table 4 Association Between Various Demographic Characteristics, Disease Severity Form, Comorbidities, and Unfavourable Outcome in the Study Group, Based on Spearman Correlation and Univariate Logistic Regression Analysis
Table 5 Correlation Between Paraclinical Factors and Unfavourable Outcome in the Study Group, Based on Spearman Correlation and Univariate Logistic Regression Analysis
Table 6 Correlation Between Selected Clinical Risk Factors and Unfavourable Outcome in the Study Group Using Multivariate Logistic Regression
Table 7 Correlation Between Paraclinical Risk Factors and Unfavourable Outcome in the Study Group Using Multivariate Logistic Regression
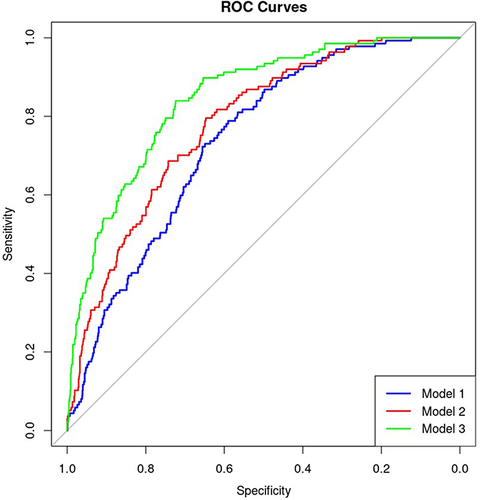
Figure 1 Receiver operating characteristic (ROC) curves illustrating the performance of proposed predictive models in distinguishing high-risk and low-risk patients within the study group dataset.
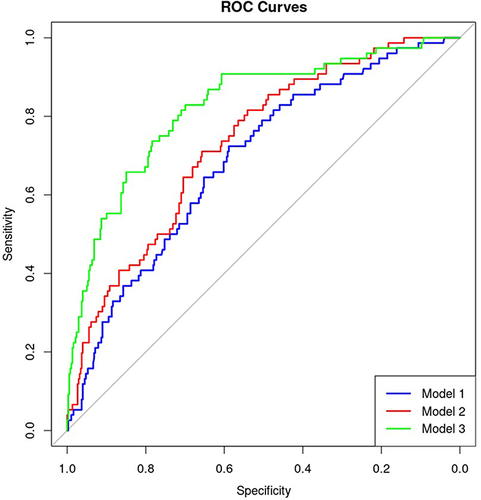
Figure 2 Receiver operating characteristic (ROC) curves illustrating the performance of proposed predictive models in distinguishing high-risk and low-risk patients within the extended group dataset.