Figures & data
Table 1 Clinical Characteristics of OV Patients
Figure 1 Expression patterns of KRT19 in tumors and normal tissues. (A) KRT19 mRNA levels in distinct tumors and normal controls using TCGA and GTEx databases. (B) KRT19 expression in OV and normal ovarian tissues based on TCGA, GTEx and GEO databases. (C) KRT19 protein levels in OV and normal ovarian tissues analyzed by the UALCAN database. (D) Representative results of immunohistochemically stained KRT19 proteins in OV and normal ovarian tissues from Human Protein Atlas. ns, no significant difference; *p < 0.05; **p < 0.01; ***p < 0.001.
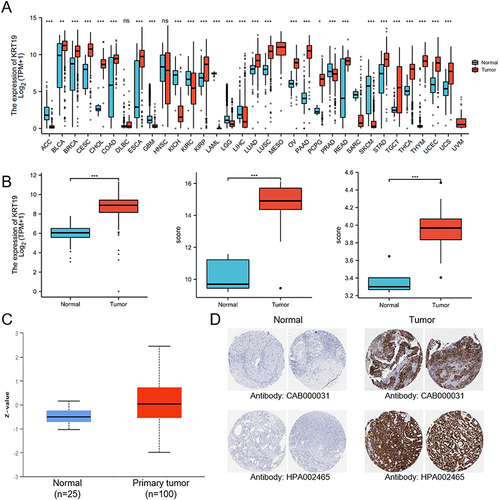
Table 2 Correlations Between OS and mRNA Expression of KRT19 Analyzed by Univariate and Multivariate Cox Regression
Figure 2 Diagnostic and prognostic value of KRT19 in OV. (A–C) Kaplan–Meier curves for OS, PFI and DSS in OV patients. Effects of KRT19 expression on PFI in pathologic stages of OV for FIGO stages I and II (D), FIGO stages III and IV (E), PD and SD (F), PR and CR (G). (H) ROC curve of KRT19 mRNA expression in OV cohort.
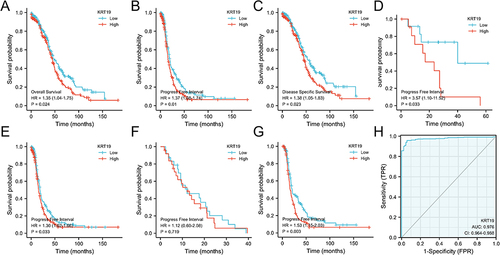
Figure 3 Univariate and multivariate regression analysis of KRT19 and clinicopathologic factors with OS in OV patients.
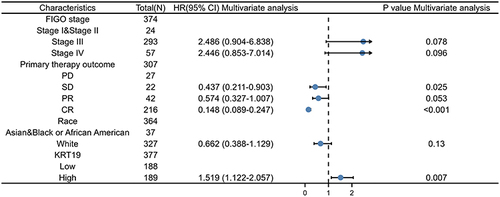
Figure 4 Enrichment hallmarks from the gene set enrichment analysis (GSEA). (A) Apical junction. (B) Inflammatory response. (C) TNFA signaling via NFKB. (D) Epithelial mesenchymal transition.
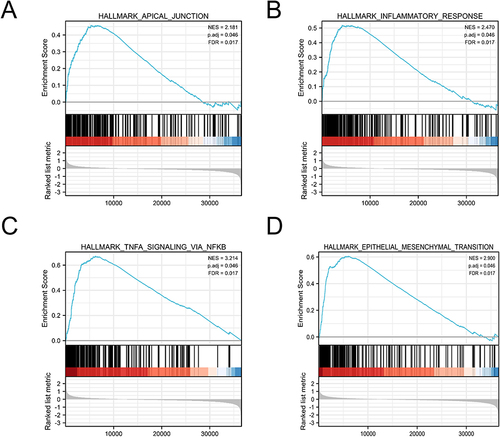
Figure 5 Gene expression and enrichment of KRT19 associated genes in OV. (A) Heatmap of the top 50 genes positively correlated with KRT19 in OV. (B) Heatmap of the top 50 genes negatively correlated with KRT19 in OV. (C) Enrichment of biological processes with KRT19 co-expression genes in OV by GO–KEGG analysis.
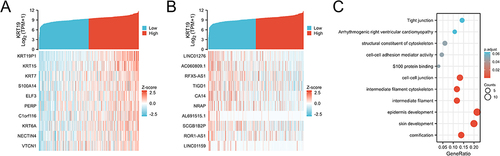
Figure 6 Biological processes regulated by the KRT19 gene in OV from CancerSEA. (A) The positive or negative biological function associated with KRT19 in OV by single cell analysis. (B) The association of KRT19 gene with metastasis and invasion of OV cells. (C) Expression distribution with t-SNE plot of KRT19 in OV. ***p < 0.001.
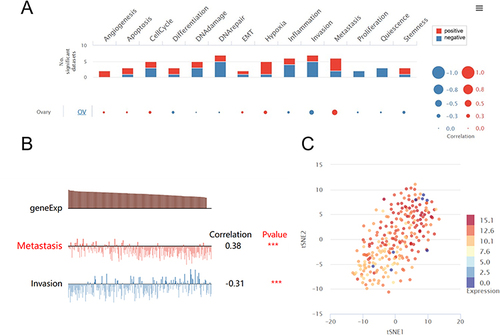
Figure 7 KRT19 gene expression in various ovarian cells. (A) KRT19 expression in different groups of GSE69428; (B) Density plot in different groups of GSE69428; (C) KRT19 expression in different groups of GSE40595; (D) Density plot in different groups of GSE40595.
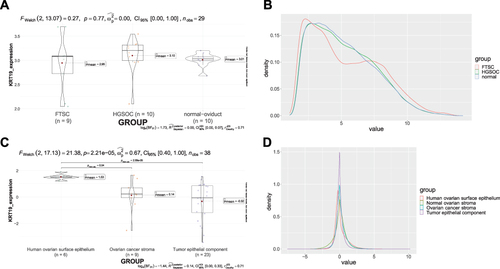
Figure 8 Association analysis of KRT19 gene expression with immune infiltration. (A) Correlation between KRT19 expression and 24 tumor-infiltrating lymphocytes. (B–G) Correlations of KRT19 level with immune infiltration level of (B) Neutrophils, (C) NK CD56dim cells, (D) Mast cells, (E) DC cells, (F) Th17 cells, (G) iDC cells, (H) Macrophages, (I) Th1 cells, (J) Tem cells.
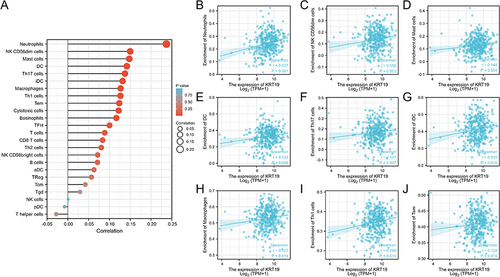
Figure 9 Correlation analysis between KRT19 expression and immunoinhibitors and immunostimulators in pan-cancers. (A) Correlation heatmap between KRT19 and immunoinhibitors in tumors. (B) Correlation heatmap between KRT19 and immunostimulators in tumors.
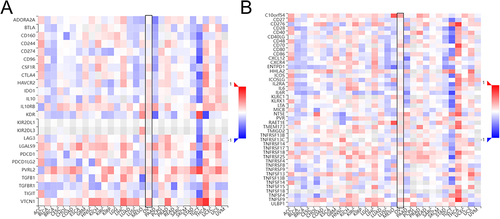
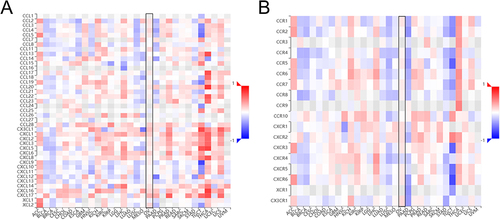
Figure 10 Correlation analysis between KRT19 expression and chemokines and receptors in pan-cancers. (A) Correlation heatmap between KRT19 and chemokines in tumors. (B) Correlation heatmap between KRT19 and receptors in tumors.