Figures & data
Figure 1 GLYATL1 expression showed a decrease in ccRCC tissues compared with normal renal tissues. (A) The data of 535 tumours and 72 normal renal samples were obtained from The Cancer Genome Atlas. (B) GLYATL1 expression data in pan-cancer from the TIMER database (https://cistrome.shinyapps.io/timer/). (C–F) GLYATL1 expression shows a significant decrease with higher histological grade, T stage, distant metastasis and advanced TNM stages. *p < 0.05, **p < 0.01, ***p < 0.001.
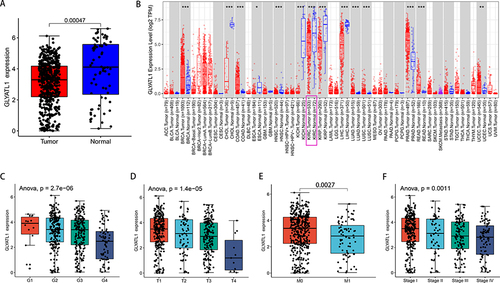
Table 1 Correlations Between the Expression of GLYATL1 and Clinicopathologic Characteristics in Clear Cell Renal Cell Carcinoma
Figure 2 Protein expression levels of GLYATL1 in ccRCC and normal renal tissues. (A) Representative images of immunohistochemically stained tumours and normal renal tissues. Case 1 represents a cohort of ten cases from the MZPH; case 2 represents a cohort of 75 cases derived from a tissue chip (magnification, ×200). (B) Comparison of the IHC scores of ccRCC and normal renal tissues.
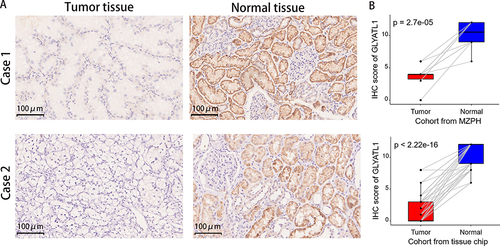
Figure 3 The prognostic value of GLYATL1 in ccRCC cohort from The Cancer Genome Atlas. (A and B) Decreased GLYATL1 expression was correlated with poor OS and DFS in patients with ccRCC. (C and D) Univariate and multivariate Cox regression analyses for OS. (E and F) Univariate and multivariate Cox regression analyses for DFS.
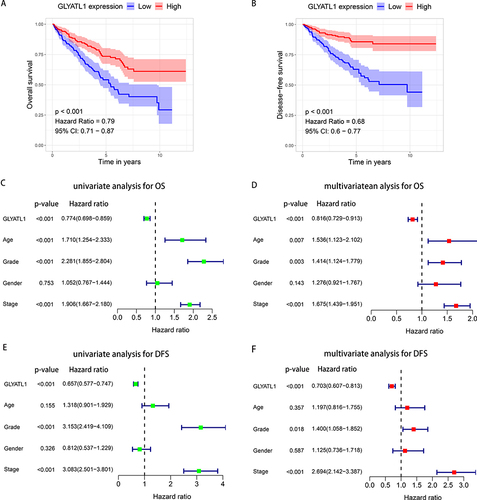
Figure 4 Stratified survival analysis for GLYATL1 expression in ccRCC cohort from The Cancer Genome Atlas. (A–C) Kaplan–Meier survival analysis for overall survival, which is stratified by age, grade, and stage. (D–F) Kaplan–Meier survival analysis for disease-free survival, which is stratified by age, grade, and stage.
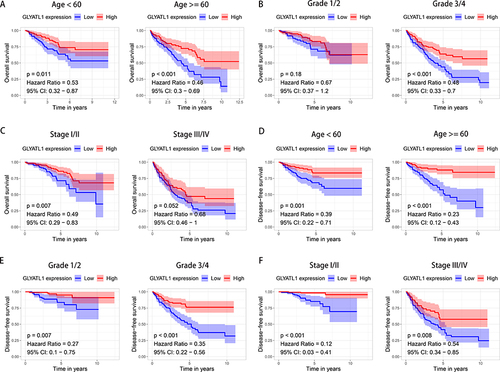
Figure 5 A nomogram based on GLYATL1 expression to predict the overall survival of patients with ccRCC. (A) The nomogram for predicting overall survival. (B) Calibration plots show the association between the nomogram-predicted overall survival and actual overall survival. The Y-axis represents the actual survival while the X-axis represents the nomogram-predicted survival. The solid and dotted lines are close, which suggests the efficient predictability of the nomogram. (C) Comparison of the predictive power of the nomogram and other independent prognostic factors for the overall survival of patients with ccRCC.
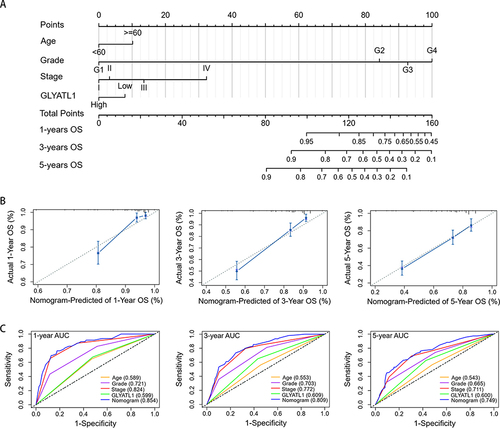
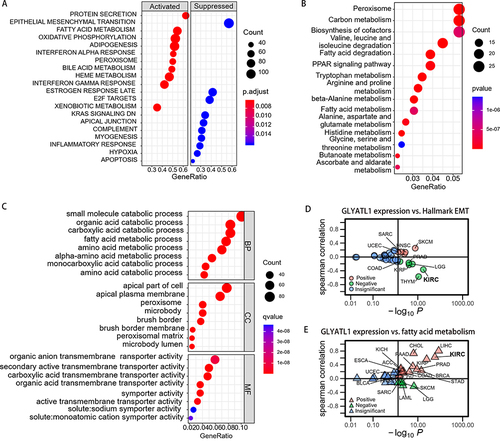
Figure 6 The results of functional enrichment analysis. (A) GSEA of GLYATL1 in ccRCC. (B) The results of KEGG analysis. (C) The results of GO analysis. (D) Correlation analysis of GLYATL1 expression and hallmark EMT pathways in pan-cancer analysis. (E) Correlation analysis of GLYATL1 expression and fatty acid metabolism pathways in pan-cancer analysis.