
Figures & data
Figure 1 Schematic workflow of the study. RT-qPCR analysis of MALAT1 was performed in the tumour tissue and adjacent mucosa of CA patients (n=14) who were part of the pilot study and further in the plasma of CFI (n=48), CA patients (n=97) and CRC patients (n=101).
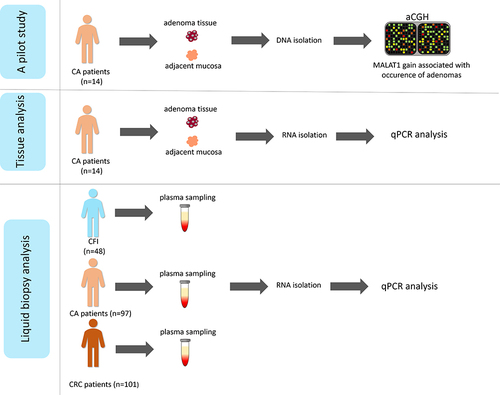
Table 1 CA Patient’s Clinical Characteristics
Table 2 CRC Patient’s Clinical Characteristics
Figure 2 The expression levels of MALAT1 in the tissue of CA patients from the pilot phase. No significant difference was observed between the groups with and without MALAT1 amplification (p=0.08, 2.08-fold-change).
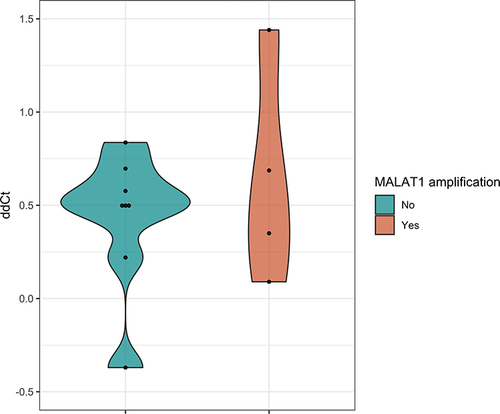
Figure 3 The expression level of MALAT1 in plasma. There are significant differences between CA and CRC patients compared to CFI (CA vs CFI – p<0.001, 5.25- fold change; CRC vs CFI – p<0.001, 5.16-fold change). The asterisk indicator (***) represents p ≤ 0.001.
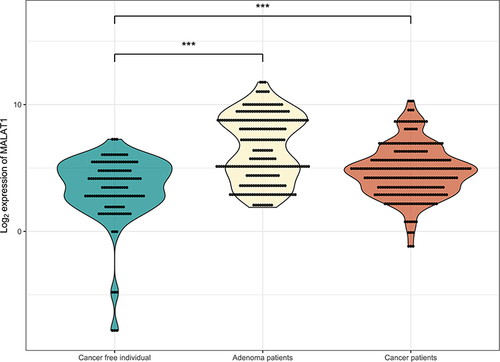
Figure 4 The expression level of MALAT1 in different types of adenomas. There was a significant difference between hyperplastic (H; n=9) and tubulovillous/villous (TLV; n=30) adenomas (p=0.002, 6.14-fold change). Tubular (T; n=50) adenomas did not show a significant difference in MALAT1 expression (p=0.15, 3.09-fold change). The asterisk indicator (**) represents p ≤ 0.01.
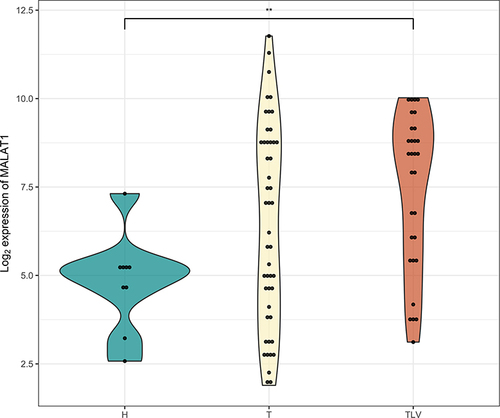
Figure 5 The expression level of MALAT1 in CRC patients divided according to therapy response. There was a significant difference between good (n=52) and poor responders (n=42; p=0.04, 1.86-fold change). The asterisk indicator (*) represents p ≤ 0.05.
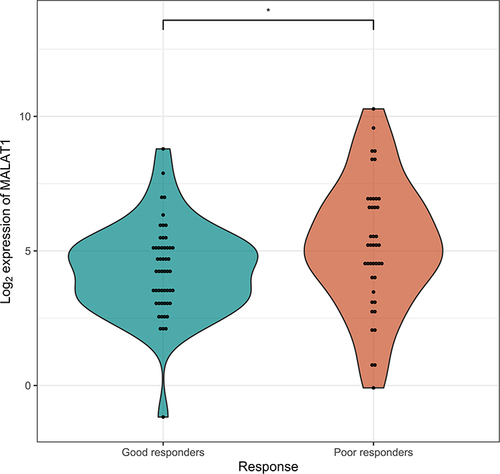
Table 3 The List of MALAT1 Targets Related to Biological Processes
Table 4 The List of MALAT1 Targets Related to Molecular Functions
Table 5 The List of MALAT1 Targets Related to Cellular Components