Figures & data
Table 1 Bivariate Correlation Analysis of Serum Stanniocalcin-1 Levels After Acute Intracerebral Hemorrhage
Figure 1 Dynamic change of serum stanniocalcin-1 levels after acute intracerebral hemorrhage. Serum stanniocalcin-1 levels were substantially elevated in patients, with a maximum value on days 1 and 2 after acute onset, and significantly higher levels than controls persisted until day 7 following acute stroke (P<0.001).
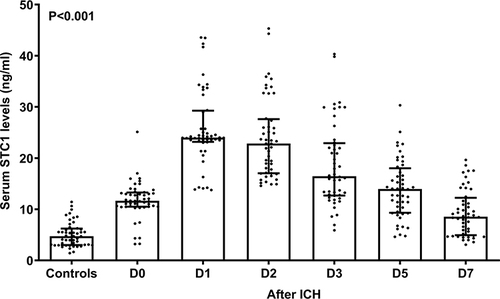
Figure 2 Relationship between serum stanniocalcin-1 levels and National Institutes of Health Stroke Scale scores after acute intracerebral hemorrhage. Serum stanniocalcin-1 levels were highly correlated with National Institutes of Health Stroke Scale scores (ρ=0.611).
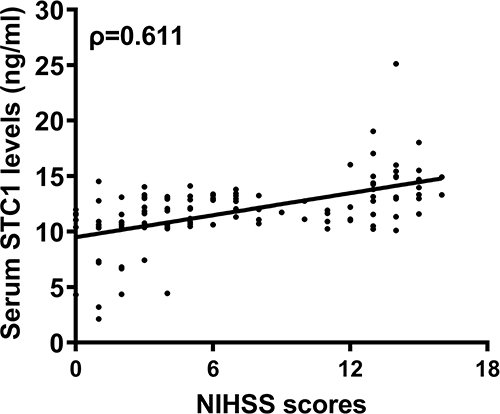
Figure 3 Relationship between serum stanniocalcin-1 levels and hematoma volume after acute intracerebral hemorrhage. Serum stanniocalcin-1 levels were highly correlated with hematoma volume (ρ=0.577).
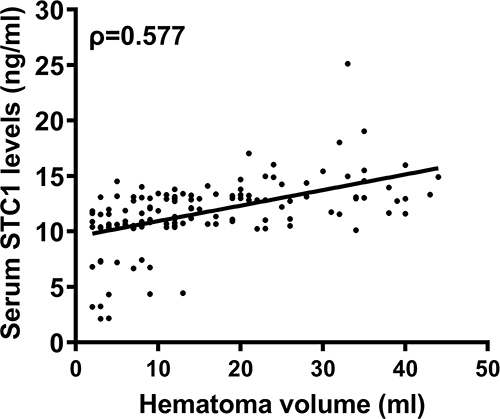
Table 2 Bivariate Correlation Analysis of Modified Rankin Scale Scores 6 Months After Acute Intracerebral Hemorrhage
Figure 4 Relationship between serum stanniocalcin-1 levels and modified Rankin Scale scores at 6 months after acute intracerebral hemorrhage. Serum stanniocalcin-1 levels were highly correlated with modified Rankin Scale scores (ρ=0.617).
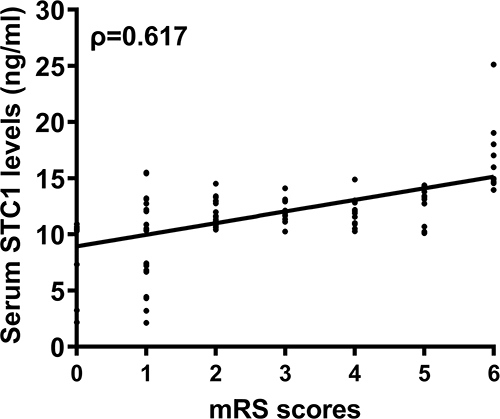
Figure 5 Differences in terms of serum stanniocalcin-1 levels among subgroups based on modified Rankin Scale scores at 6 months after acute intracerebral hemorrhage. Serum stanniocalcin-1 levels significantly increased in the order of modified Rankin Scale scores from 0 to 6 (P<0.001).
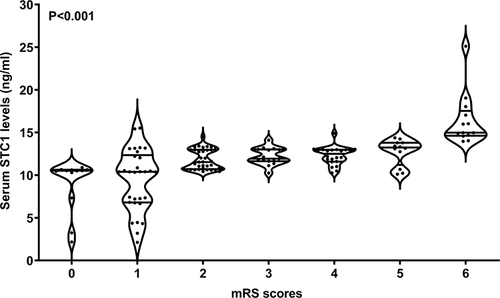
Figure 6 Differences in terms of serum stanniocalcin-1 levels between patients with poor prognosis and those with good prognosis at 6 months after acute intracerebral hemorrhage. Serum stanniocalcin-1 levels were significantly higher in patients with poor prognosis than in those with good prognosis (P<0.001).
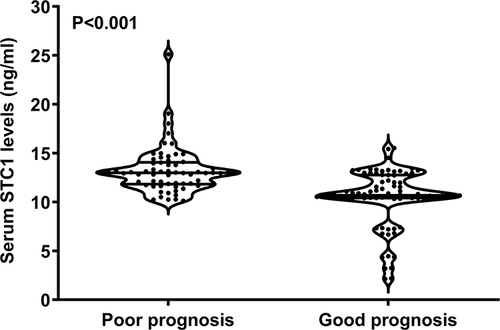
Figure 7 Receiver operating characteristic curve analysis with respect to serum stanniocalcin-1 levels for prognostic prediction of acute intracerebral hemorrhage. Serum stanniocalcin-1 levels were significantly predictive of poor prognosis six months after stroke.
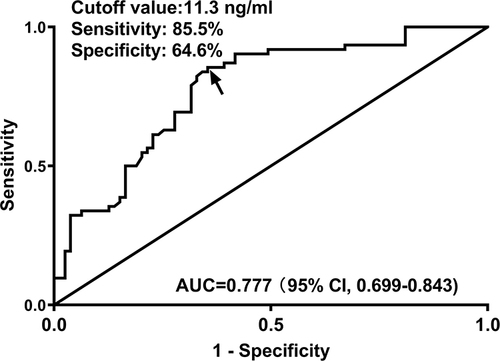
Figure 8 Comparisons of prognostic predictive abilities between prediction model and other variables among patients with acute intracerebral hemorrhage. The area under the curve of serum stanniocalcin-1 levels was equivalent to that of the National Institutes of Health Stroke Scale score and hematoma volume. The area under the curve of serum stanniocalcin-1 levels combined with National Institutes of Health Stroke Scale scores and hematoma volume was significantly higher than those of the National Institutes of Health Stroke Scale scores, hematoma volume, serum stanniocalcin-1 levels, and the combination of National Institutes of Health Stroke Scale scores and hematoma volume.
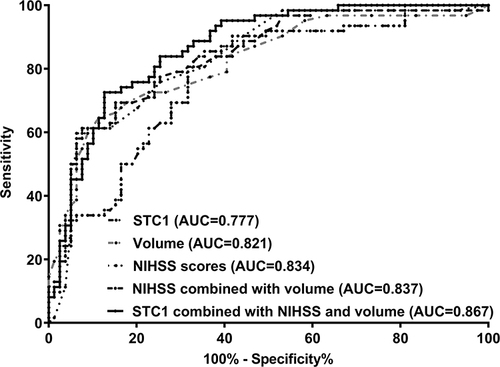
Table 3 Factors Related to a Poor Prognosis 6 Months After Acute Intracerebral Hemorrhage
Figure 9 A nomogram integrating National Institutes of Health Stroke Scale scores, hematoma volume and serum stanniocalcin-1 levels for prognostic prediction among patients with acute intracerebral hemorrhage. The prediction model could be visually described using a nomogram, in which the National Institutes of Health Stroke Scale scores, hematoma volume, and serum stanniocalcin-1 levels were combined to predict ICH prognosis of intracerebral hemorrhage.
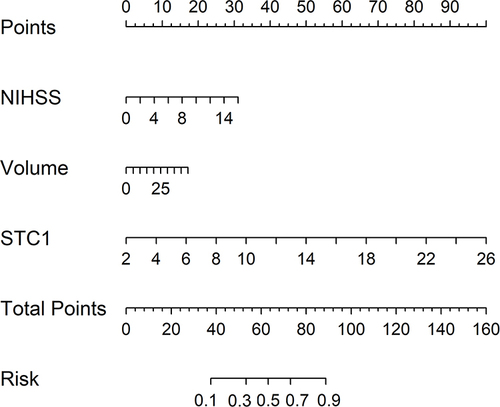
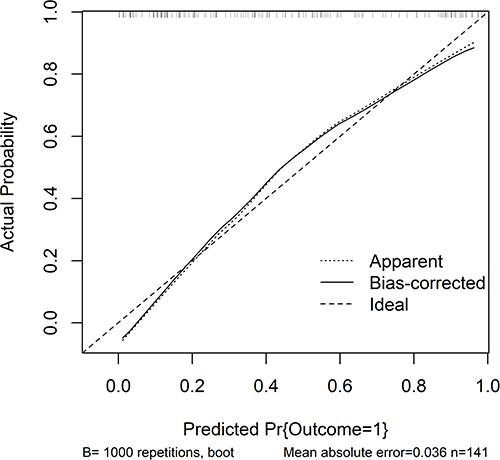
Figure 10 Calibration curve verifying the stability of prediction model for prognosis of acute intracerebral hemorrhage. The calibration curve analysis showed that the prediction model was stable because of the comparatively small mean absolute error.