Figures & data
Figure 1 Correlation Analysis between NNMT and CKD clinical variables. (A) The expression level of NNMT between healthy living donors and CKD; (B) NNMT mRNA levels in different CKD stages; (C) Correlation analysis between NNMT mRNA level and eGFR. (D) NNMT mRNA levels in different types of chronic kidney disease. *P < 0.05; **P < 0.01; ***P < 0.001.
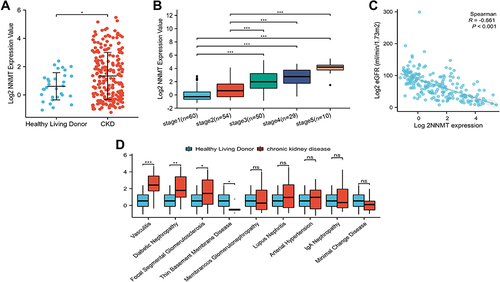
Figure 2 Analysis of GO and KEGG. (A) The intersection of candidate gene sets contains 57 genes for the co-expressed genes that were screened at Pearson’s correlation coefficient |r|>0.5 from JU CKD and JU CKD2 data sets in the NephroseqV5 database; (B) Description of KEGG pathway enrichment analysis of 57 genes pathway (C) Description of GO pathway enrichment analysis of 57 genes pathway.
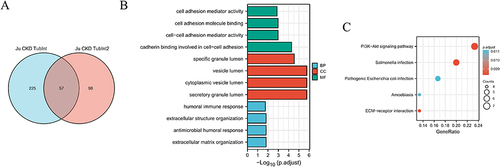
Table 1 Association Between Clinical Characteristics and NNMT Expression in CKD Cohort
Figure 3 Survival curves of high and low expression of NNMT.
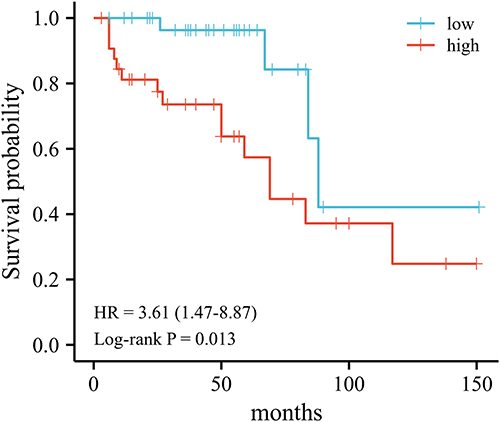
Figure 4 Correlation between NNMT and CKD progression. (A) NNMT mRNA levels in CKD kidney tissue; (B) One-way COX regression analysis; (C) multi-way COX regression analysis model; (D) time-dependent ROC curves.
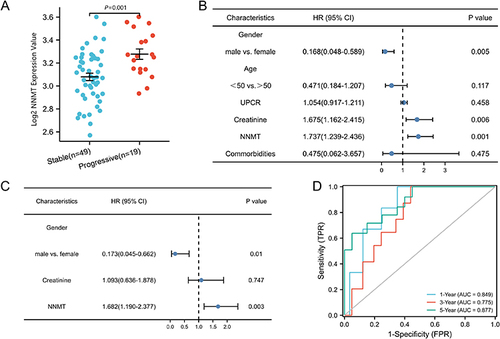
Table 2 NNMT Expression and Clinicopathological Parameters in the Validation Set
Figure 5 Correlation analysis between NNMT and the degree of renal fibrosis. (A) NNMT expression levels in CKD kidney tissues; (B) NNMT correlation analysis with fibrosis index; (C) Correlation analysis between NNMT and eGFR. *P < 0.05; **P < 0.01; ***P < 0.00.
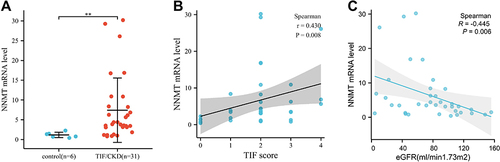
Figure 6 Classification of cell clusters and location of marker genes. (A) tSNE plot of cell clusters identified based on the expression of highly variable genes. (B) UMAP plot of cell clusters identified based on the expression of highly variable genes. (C) UAMP plot showing the cell clusters where NNMT is located; (D) tSNE plot showing the cell clusters where NNMT is located; (E) NNMT expression was significantly upregulated in the proximal tubule cell by exploring HPA.
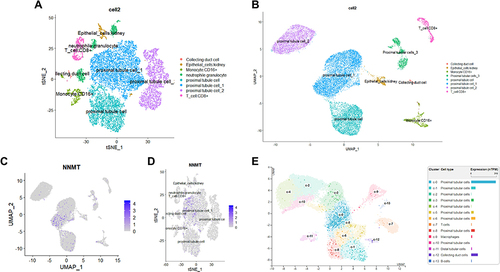
Figure 7 NNMT compartment-specific expression in the kidney. Notice. (A) Location distribution of NNMT mRNA expression levels in renal tissue; (B) Immunohistochemical map of NNMT expression in normal kidney.
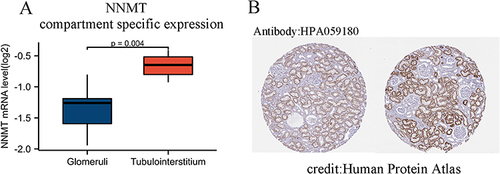
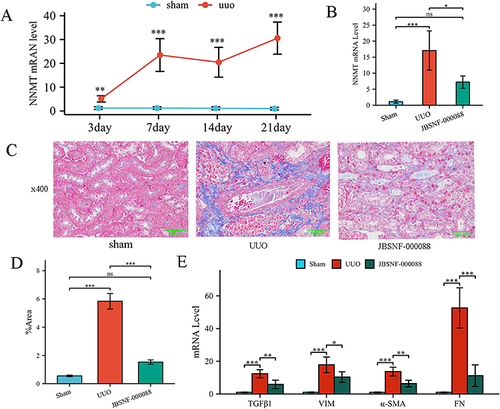
Figure 8 JBSNF-00008 attenuated the degree of renal fibrosis in the UUO model. (A) Detection of NNMT mRNA levels in kidney tissues of UUO model mice by qRT-PCR. (B) NNMT mRNA levels in renal tissues of drug-treated UUO mice were measured by RT-qPCR; (C) Masson staining of kidney tissues (x400); (D) Semi-quantitative statistical comparison of Masson stained blue collagen area; (E) qRT-PCR detection of mRNA levels of fibrosis indicators in kidney tissues; comparison between groups. ns, P >0.05, *P < 0.05; **P < 0.01. ***P < 0.001.