Figures & data
Table 1 Clinical Information of 41 Patients with COAD for Real-Time PCR
Figure 1 MORC2 expression in COAD tissues. (A) The comparison of MORC2 expression between tumor and pericarcinous tissue in different types of cancers based on TCGA database. (B) Expression of MORC2 in COAD were analyzed based on tissue samples present in the TCGA database. (C) Comparing the expression of MORC2 in normal tissue and primary tumor. (D) Expression of MORC2 in COAD were analyzed by using the UALCAN website. (E) Relative mRNA level of MORC2 in cancer and adjacent tissues of COAD. (F and G) Images of immunohistochemical staining showing MORC2 protein expression in colorectal tissue from The Human Protein Atlas. (H) Volcano plots of the DEGs. Blue represents down-regulated DEGs, red represents up-regulated DEGs. ns, P ≥ 0.05; *P < 0.05; ***P < 0.001.
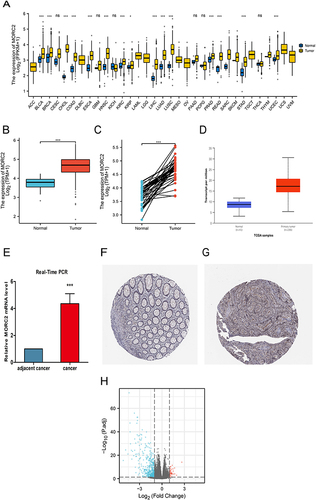
Table 2 Details of GO and KEGG Enrichment Analyses
Table 3 Relationship Between MORC2 Expression and Clinicopathological Characteristics in Patients with COAD
Table 4 MORC2 Expression Correlated with Clinical Pathological Characteristics (Logistic Regression)
Figure 2 Relationship between MORC2 expression and clinical indicators in patients with COAD; (A) Subgroup analysis of MORC2 expression in COAD based on patient age; (B) Subgroup analysis of MORC2 expression in COAD based on patient weight; (C) Subgroup analysis of MORC2 expression in COAD based on the patient gender; (D) Subgroup analysis of MORC2 expression in COAD based on patient race; (E) Subgroup analysis of MORC2 expression in COAD based on individual cancer stages; (F) Subgroup analysis of MORC2 expression in COAD based on histological subtypes; (G) Subgroup analysis of MORC2 expression in COAD based on nodal metastasis status; (H) Subgroup analysis of MORC2 expression in COAD based on TP53 mutation status.
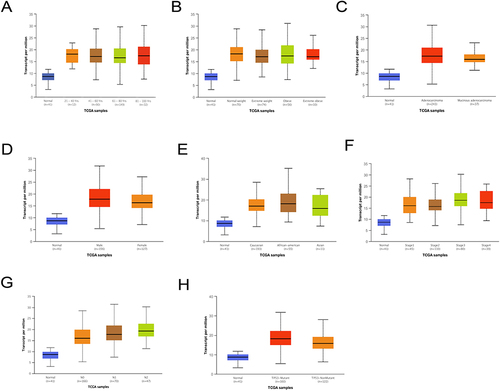
Table 5 MORC2 Expression Based on Different Clinical Indicators
Table 6 Univariate and Multivariate Regression Analysis of Overall Survival (OS)-Related Factors in Patients with COAD
Figure 3 Predictive value of MORC2 expression for diagnosis and clinical outcomes in COAD patients; (A–C) OS, PFI, and DSS of patients with COAD based on MORC2 expression determined using R packages survival and survminer; (D and E) OS and DFS of patients with COAD based on MORC2 expression determined using GEPIA; (F) Effect of MORC2 expression level on COAD patient survival using UALCAN database; (G and H) DFS and OS of patients with COAD based on MORC2 expression determined using the PrognoScan database; (I) ROC curve showed MORC2 was an accurate ability to identify tumor from normal tissue. The AUC was 0.939.
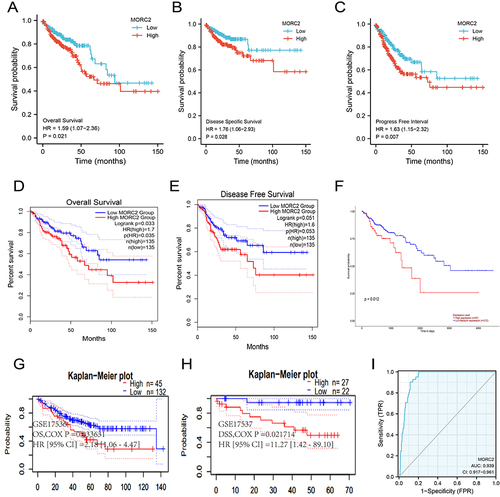
Figure 4 Analysis of the diagnostic value of MORC2 for COAD patients with different stages or grades. (A–D) ROC curve analysis of the diagnostic value of MORC2 in patients with COAD at T stage. (E–H) ROC curve analysis of the diagnostic value of MORC2 in patients with COAD at N and M stages. (I–L) ROC curve analysis of the diagnostic value of MORC2 in patients with COAD at TNM stage.
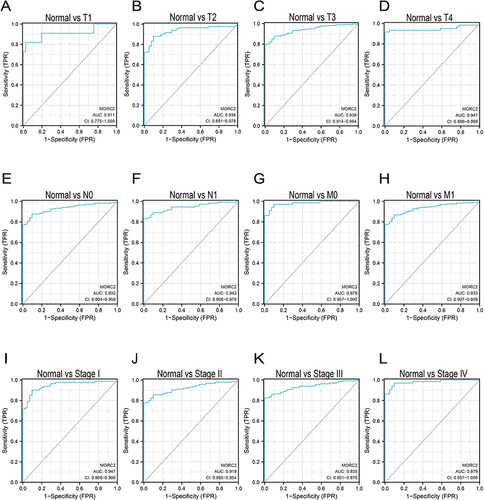
Figure 5 Construction and validation of nomograms based on MORC2 expression. (A) Shown are the nomograms constructed to establish MORC2 expression-based risk scoring models for 1-, 3-, and 5-year survival probability. (B–D) Calibration plots validating the efficiency of nomograms for 1-, 3-, and 5-year survival probability.
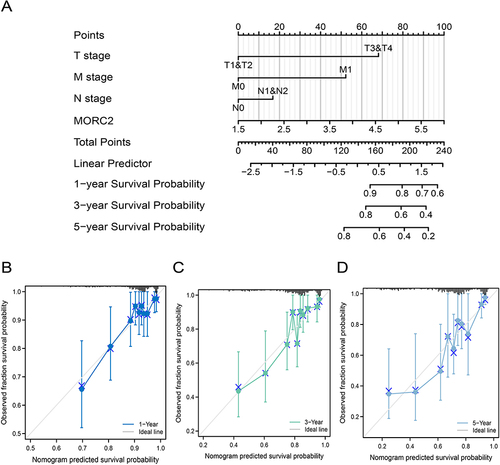
Figure 6 Analysis of MORC2 genetic alterations using the cBioPortal database. (A) Alteration frequency of MORC2 in different COAD studies. (B) Fraction genome altered of MORC2 based on 480 COAD samples. (C) The percentage of alteration in MORC2 in COAD. (D) Mutation diagram providing information on the mutation sites, mutation types, and the number of cases, and the results were colored with respect to the corresponding mutation types.
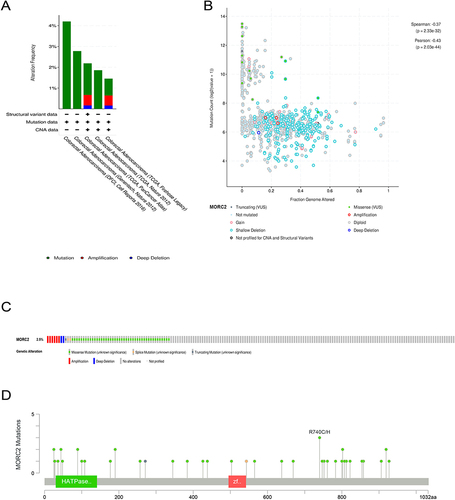
Figure 7 Correlation between expression of MORC2 and immune infiltration; (A) Correlation between expression of MORC2 and immune cells infiltration; (B) The association of MORC2 expression with ImmuneScore; (C) The association of MORC2 expression with ESTIMATEScore; (D) The association of MORC2 expression with StromalScore. ns, P ≥ 0.05; ***P < 0.001.
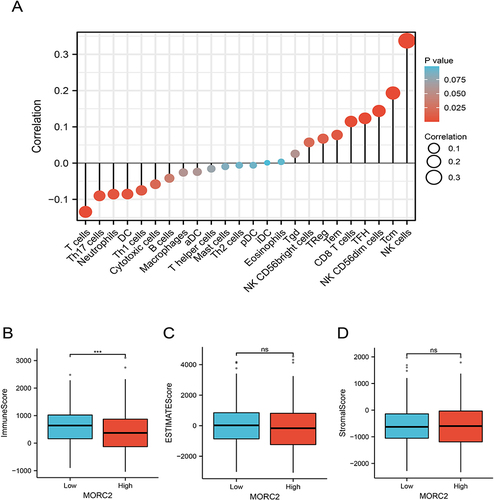
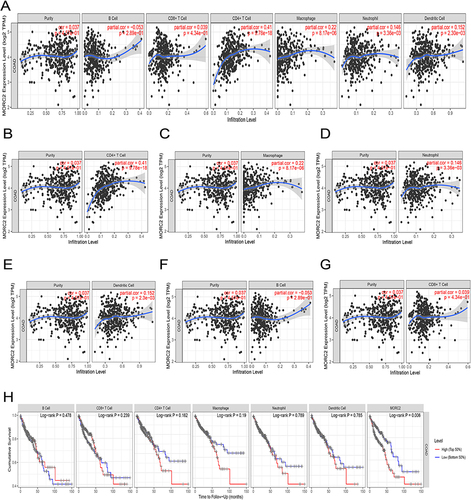
Figure 8 Correlation analysis between the MORC2 expression level and immune cell infiltration in COAD using the TIMER database; (A–G) The association of MORC2 expression with tumor purity and six types of immune cell infiltration level; (H) Relationship between immune cell abundance and cumulative survival of patients with COAD.