Figures & data
Table 1 Top 20 DEGs in HCC Relapse After LT
Figure 1 Identification of DEGs and functional enrichment. (A) The volcano plot of DEGs, blue dots indicate down-regulated genes, gray dots indicate stable genes, while red dots indicate up-regulated genes; (B) The heat map of DEGs, each row corresponds to the expression profile of an HCC sample, and each row column corresponds to a gene. The higher intensities of red mean higher expression level, while the lower intensities of blue mean lower expression level; (C) The top 15 enriched terms in GO enrichment of DEGs; (D) The KEGG pathway of DEGs, the size of the dot represents the number of genes contained in the pathway, and the larger the dot, the more genes. The color of the dots represents the difference in the pathway between the normal and recurrent groups, with a redder color indicating a smaller p-value.
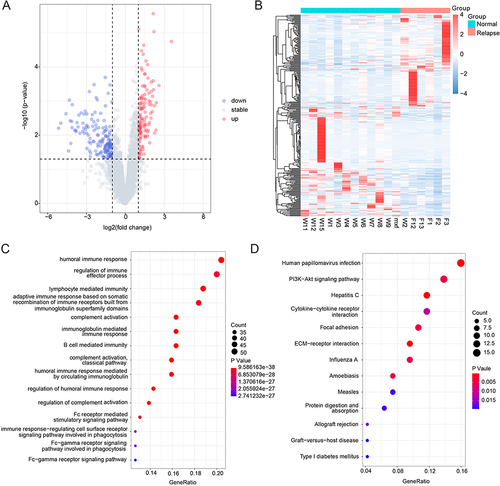
Figure 2 The protein-protein interaction (PPI) network. (A) The PPI network of DEGs, marked in red indicates up-regulation of the gene, while blue indicates down-regulation of the gene, the connecting lines indicate the association of the two genes; (B) The top 10 genes with higher degree.
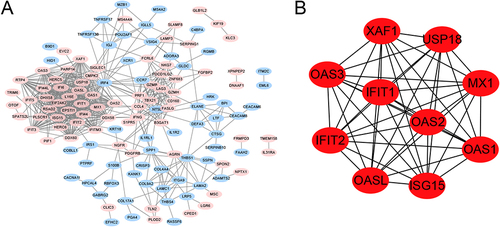
Figure 3 The immune-correlation analysis. (A) The immune cells abundance between the normal and relapse groups, *represents P-value <0.05, **represents P-value <0.01, ns represents non-significant; (B) The proportion of each immune cell in the normal group and the relapse group; (C) Venn for the intersection genes in immune-related functional genes and DEGs; (D) The gene set to which intersecting genes belong.
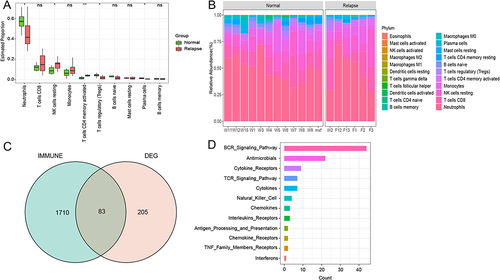
Figure 4 The GO enrichment and KEGG pathways of intersection genes. (A) The top 15 GO terms of intersection genes; (B) The top 15 KEGG pathways of intersection genes.
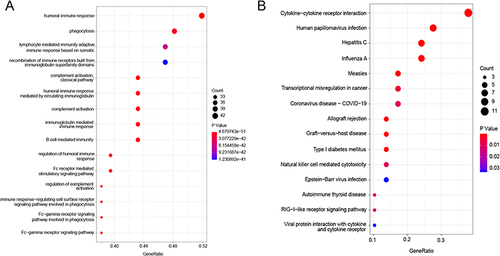
Figure 5 The immune repertoire analysis. (A) The comparison of the number of complete amino acid in CDR3 region between normal and the relapse groups; (B) The clone distribution of the normal group and the relapse group, unique (n =1), duplicated (n =2), and clonal (n ≥3) are labeled with different colors; (C) The comparison of the length of amino acids in CDR3 region between normal and relapse groups; (D) The comparison of amino acid sequence diversity in CDR3 region between normal and relapse group; The diversity of CDR3 amino acid sequence was calculated using Shannon-Weiner diversity index. P-value was calculated using the Mann–Whitney U-test; (E and F) The frequency and differential analysis of V and J gene segments of normal and relapse group.
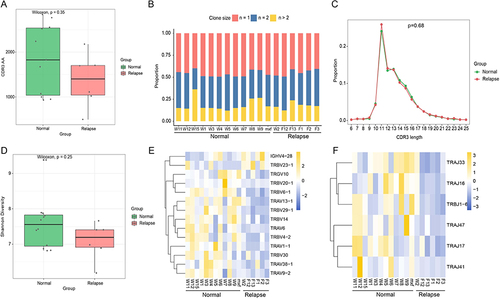
Figure 6 The transcription factor regulatory network of key genes. Pink represents key genes and blue was the associated transcription factors, the connecting lines indicate the association of the two genes.
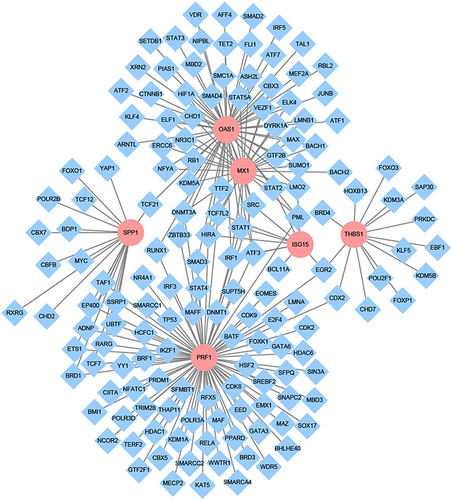
Figure 7 The effect of copy number alterations of key genes in HCC on immune cells. (A-F) the copy number alterations of MX1, ISG15, OAS1, PRF1,SPP1, and THBS1 in HCC on immmune cells, *Represents P-value <0.05.
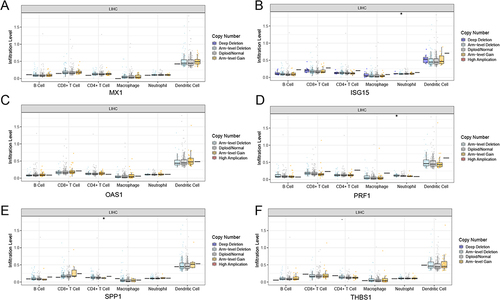
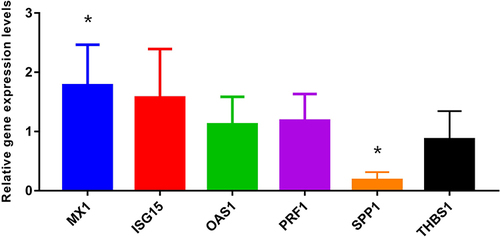
Figure 8 The RT-qPCR validation. *Represents P-value <0.05.