Figures & data
Table 1 Primer Sequences, Annealing Temperatures, and Lengths of the Amplified Fragments
Figure 1 Gender distribution of study population.
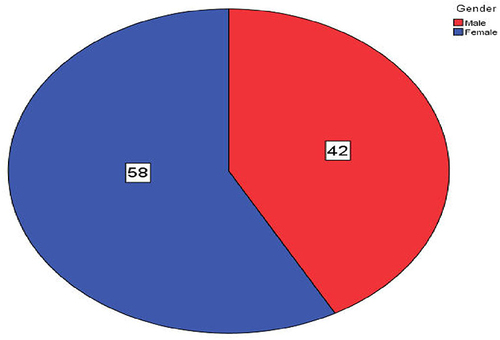
Table 2 Gender and Age Group Distribution of the Study Population
Figure 2 PCR products were run on 2% agarose gel. Lane M 100bp DNA Marker. Lane 1: amplified PCR product of fragment one (520 bp). Lane 2: amplified PCR product of fragment 2 (532 bp). Lane 3: amplified PCR product of fragment 3 (476bp).
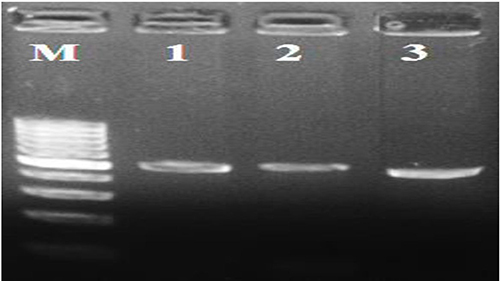
Figure 3 Partial chromatogram represents the normal (wild) and the mutant sequences of the beta-globin gene codon 6 (HbS). (a) shows the wild-type sequence. (b) shows the homozygous mutation (HBB):c.20A>T (p.Glu7Val). (c) shows the heterozygous mutation.
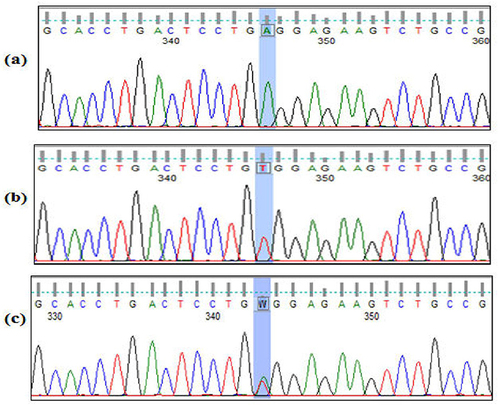
Table 3 Hb O-Arab Mutation Screening Results After Sequencing
Table 4 Hb O-Arab Mutation After HBB Gene Sequencing
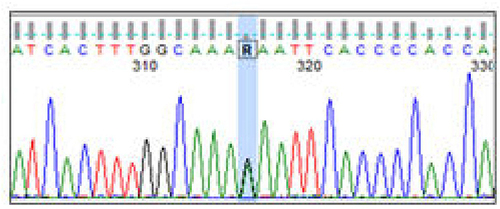
Figure 4 The heterozygous Hb O-Arab variant (HBB):c.364G>A (p.Glu122Lys). Partial chromatogram representing sequencing analysis of intron two and exon 3 of the beta-globin gene.