
Figures & data
Table 1 Comparison of the General Information
Figure 1 Comparison of compliance, ***Indicated P < 0.001.
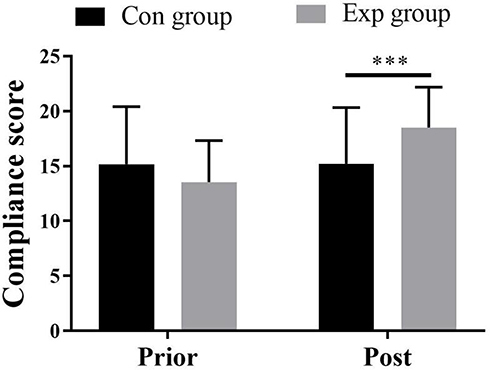
Table 2 Comparison of Behaviors Following Doctor Instructions ()
Figure 2 Comparison of the psychological state. (A) SDS score. (B) SAS score. ***Indicated P < 0.001.
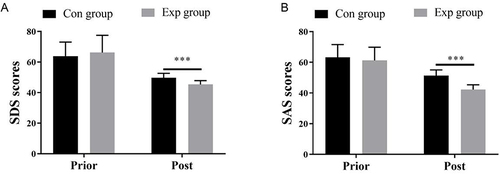
Table 3 Comparison of the QoL ()
Table 4 Comparison of the Blood Lipid Levels ()
Table 5 Comparison of the Satisfaction [n (%)]