
Figures & data
Table 1 Demographic and Clinical Measurement in CRAO and HCs Groups
Table 2 Brain Regions with Significant Differences in ReHo Values Between CRAO and HCs Groups
Figure 1 The anatomical distribution of ReHo was exhibited at the group level in CRAO and HCs groups in a typical frequency band. The one-sample t-test result of ReHo maps within the CRAO (A) and HCs (B). The color bar reflects the t values.
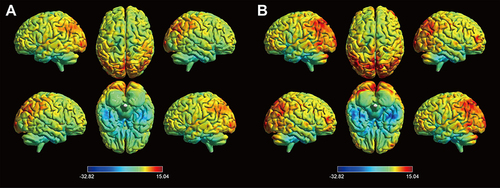
Figure 2 Brain regions with significantly different ReHo values in individuals with CRAO versus HCs. The color scale reflects the t values. Red indicates higher ReHo indices, and blue indicates low ReHo indices.
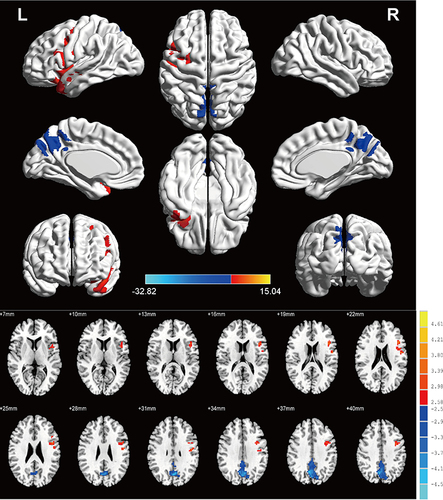
Figure 3 The mean ReHo signal values between the CRAO and HCs group. Data are presented as mean± standard deviation.
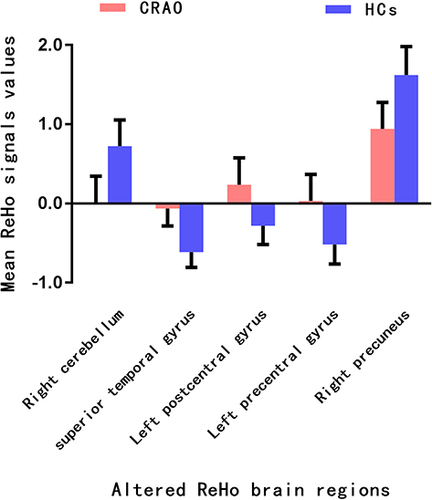
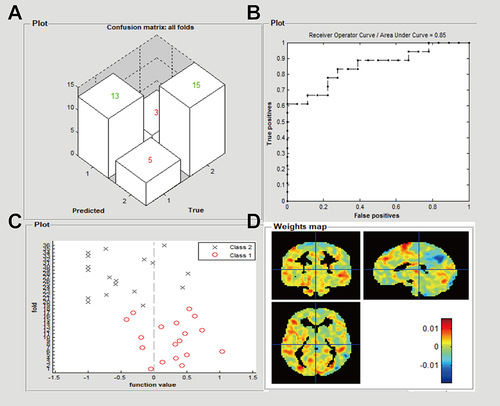
Figure 4 SVM Classification results based on the mean ReHo maps. (A) confusion matrices from machine learning analysis; green colour indicate predictive values and red colour indicate true values. (B) The receiver operating characteristic curve of the SVM classifier; (C) Function value of SVM algorithm for two groups (class 1: CRAO group; class2: HCs group). The zero line represents the decision boundary; (D) Whole-brain weight maps for SVM algorithm.
Data Sharing Statement
The raw data supporting the conclusions of this article will be made available. Further inquiries can be directed to the corresponding author.