
Figures & data
Table 1 Clinical and Laboratory Characteristics of Subjects
Table 2 RMI, sTfR, and Serum Iron Levels and the Prevalence of Anemia According to LCN2 Levels
Figure 1 Hemoglobin levels according to LCN2 levels in patients with mild renal dysfunction. Hemoglobin levels are significantly lower in patients with elevated LCN2 levels than in those without elevated LCN2 levels (12.9 ± 1.6 g/dL vs 14.0 ± 1.7 g/dL). *p < 0.001.
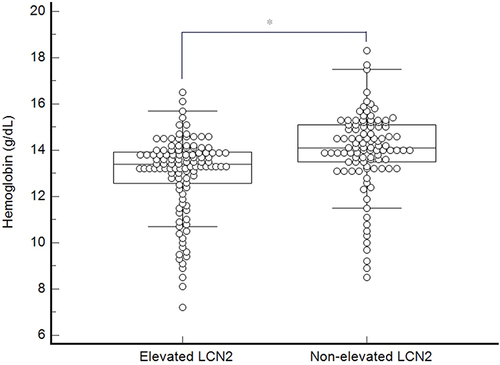
Table 3 LCN2, sTfR, and EPO Levels in Patients with and without Anemia
Table 4 Relationship Between LCN2 and sTfR, RMI, EPO, Serum Iron, and Hemoglobin Levels
Figure 2 Scatter plots of the relationship between LCN2 and hemoglobin levels in patients with mild renal dysfunction. The LCN2 levels are negatively correlated with hemoglobin levels (y = −0.011x + 13.907; r2 = 0.101; p < 0.001).
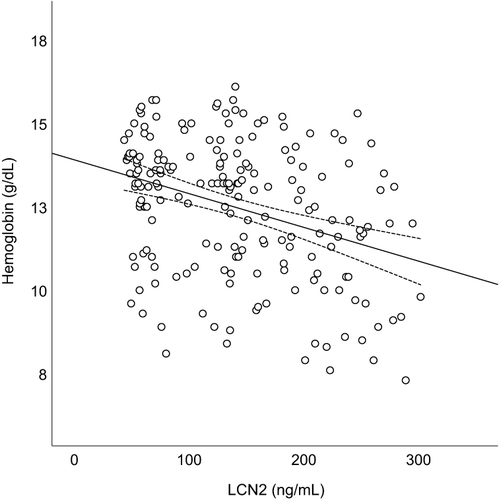
Table 5 Association Between LCN2 Elevation and the Presence of Anemia in Subjects with MRD