
Figures & data
Table 1 Demographic and Serological Descriptors of RA Patients with HC and RA Patients Without HC
Figure 1 Heat map of correlation clustering markers about the levels of C3, C4, Anti-MCV and other indexes in patients with RA.
Notes: Blue represented negative correlation, red represented positive correlation, and the color shade represented the strength of correlation. *P<0.05, **P<0.01.
Abbreviations: ESR, erythrocyte sedimentation rate; IgM, immunoglobulins; Anti-MCV, anti-mutated citrullinated vimentin antibody; RF, rheumatoid factor; RF-IgA, RF-IgG, RF-IgM, subtypes; PLT, platelets; N, neutrophils; WBC, white blood cell; C3,C4, complements; Hb, hemoglobin; L, lymphocytes.
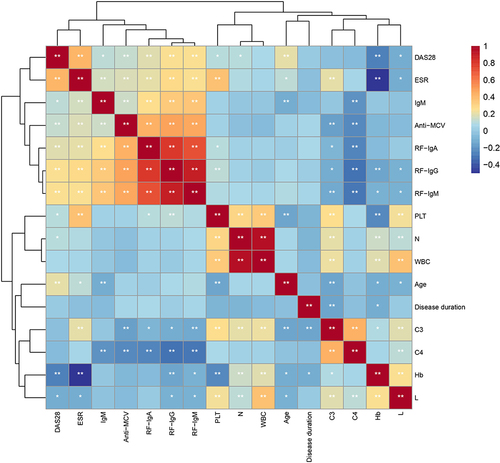
Table 2 Correlation Analysis of C3, C4 and Other Indexes in Patients with RA
Figure 2 Correlation network diagram about the levels of C3, C4, Anti-MCV and other indexes in patients with RA.
Notes: Circles of different colors and sizes represented the correlation degree of each index, with smaller circles and bluer colors indicating a lower degree of correlation, while larger circles and redder colors indicating a stronger degree of correlation; rho: the thickness of the arrow represented the magnitude of the correlation coefficient; relation: orange solid arrow represented positive correlation, gray dashed arrow represented negative correlation.
Abbreviations: ESR, erythrocyte sedimentation rate; IgM, immunoglobulins; Anti-MCV, anti-mutated citrullinated vimentin antibody; RF, rheumatoid factor; RF-IgA, RF-IgG, RF-IgM, subtypes; PLT, platelets; N, neutrophils; WBC, white blood cell; C3,C4, complements; Hb, hemoglobin; L, lymphocytes.
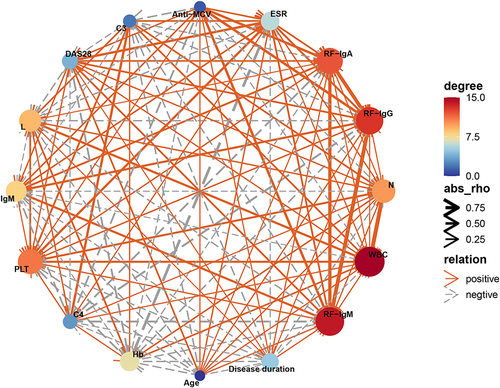
Table 3 Diagnostic Value of Anti-MCV, RF-IgM, PLT and Other Indexes in RA Patients with HC
Figure 3 ROC curves analysis to evaluate the diagnostic value of Anti-MCV, ESR, PLT and other indicators for RA patients with HC.
Notes: Different colors represented different indicators. (A) ROC curves of anti-mutated citrullinated vimentin antibody (Anti-MCV), rheumatoid factor (RF) subtypes (RF-IgA, RF-IgG, RF-IgM), and immunoglobulins (IgM); (B) ROC curves of Age, Disease duration, erythrocyte sedimentation rate (ESR) and DAS28; (C). ROC curves of white blood cell (WBC), neutrophils (N), lymphocytes (L), hemoglobin (Hb) and platelets (PLT).
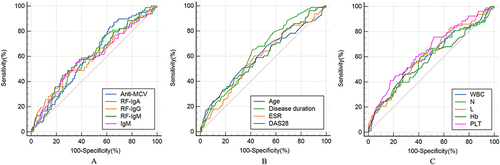
Table 4 Binary Logistic Regression Analysis of RA Patients with HC and Influencing Factors