Figures & data
Table 1 Variant Gene and Locus Statistics
Figure 1 Characteristics of SNV in HCM patients. (A), Statistics of exon region variation type. Different colors represent different mutation types. (B), Mutation signatures of different mutation types in different samples. (C), Top 15 mutation base type statistics. (D), Top 30 variant genes.
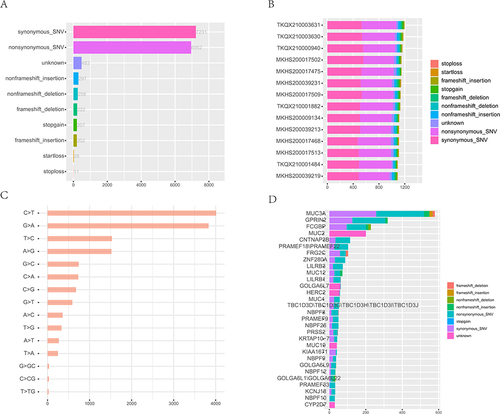
Figure 2 SNV-related variant gene functional enrichment analysis. (A), The GO analysis of SNV-related variant genes. Different color represent the FDR value. (B), The KEGG pathway analysis of SNV-related variant genes. Different color represent the FDR value. (C), The PPI analysis of SNV-related variant genes.
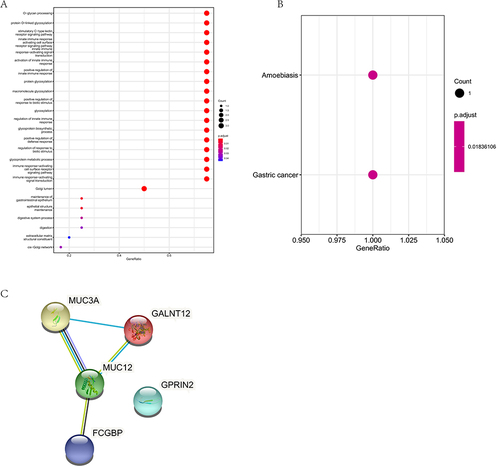
Table 2 The Number of Variants in Genes Shared by HCM Patients
Table 3 The Common Variant Loci of Shared Genes in HCM Patients
Table 4 Statistics of Variant CNV Regions in HCM Patients
Table 5 Gene Statistics in Shared CNV Regions
Figure 3 Characteristics of CNV variants in HCM patients. (A), CNV variants signature of each HCM patient. (B), Statistics of CNV variants characteristics for each chromosome.
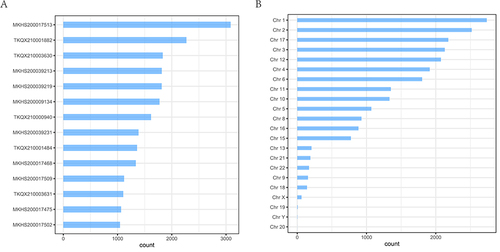
Figure 4 CNV-related variant gene functional enrichment analysis. (A), The GO analysis of CNV-related variant genes. (B), The KEGG pathway analysis of CNV-related variant genes. (C), The PPI analysis of CNV-related variant genes.
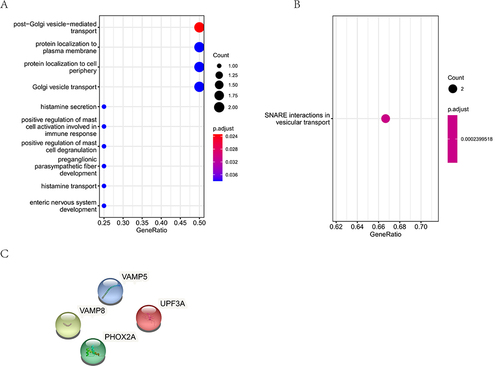
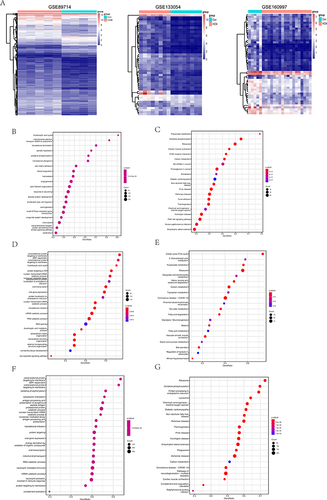
Figure 5 Transcriptomic data analysis of HCM patients. (A), Heat map of DEGs in HCM patients. From left to right are GSE89714, GSE133054 and GSE160997. (B), The GO analysis of DEGs of GSE89714. (C), The KEGG pathway analysis of DEGs of GSE89714. (D), The GO analysis of DEGs of GSE133054. (E), The KEGG pathway analysis of DEGs of GSE133054. (F), The GO analysis of DEGs of GSE160997. (G), The KEGG pathway analysis of DEGs of GSE160997.